While reading a Bloomberg article on how the default in Greece caused a loss of $1 trillion dollar in the global equity market, a question came into my mind, what is the total value of the stock market? In other words, what is the sum of the market capitalization of all listed stocks?

I researched this question on the Internet and nobody seems to have answered it before, so I decided to do it myself.

Here’s how I did it: I created a script that will go through all the currently listed stocks in both the NYSE and the NASDAQ and get the market cap of each and every stock. I then summed all the market caps, and here’s the number I got: $23,346,980,800,000. So, the total value of the US stock market (NYSE and NASDAQ) is $23.34 trillion.

Now, a few weeks ago, I have generated a list with the top 100 companies by market cap, so, what I want to know right now is how much do these companies constitute of the total worth of the stock market. If you look at the aforementioned list, the combined market cap of these companies is $11.71 trillion, which means that the top 100 listed company by market cap represent 50.17% of the total stock market value.

July 13, 2011 | In: General

When Is a Stock Overvalued?

Long term investors usually do some due diligence on a stock before buying it. This due diligence consists of knowing the long term technical information about the stock, informing themselves about the company’s business and potential future, and, of course, asking this question: Is this stock overvalued?

Knowing whether a stock is overvalued or not is critical to any long term (daytraders and short term investors don’t usually care about this) investor’s decision making for buying that stock.

So, when is a stock overvalued?

There are many signs that can tell us that a certain stock is overvalued, including, but not limited to:

  • Very high P/E Ratio: While a slightly higher than normal P/E ratio indicates that investors love the stock, a P/E that is extremely high is a sure indication that there are lots of investors who are just following the herd (e.g. buying the stock because everyone else is buying it or praising it). An example of a stock that has an extremely high P/E is LNKD: With a current P/E of 2,741, it will take LinkedIn almost 3,000 years to pay back investors! I’m not sure this whole world will still exist after 3,000 years, let alone the Internet (or LinkedIn, for that matter).

  • Stock price is moving up despite a general downtrend in the industry: While this may be perceived as “the stock is outpeforming the industry”, it may be very well the sign of a highly manipulated stock. One has to ask this question: What makes this stock so special and so good to move up while all the other stocks in the same industry are moving down?

  • The company is consistently issuing reports that are below analysts’ expectations, yet the stock is unaffected: Generally, when this happens, the stock goes considerably down, and is stuck in what I usually call “a bearish hell” until the company starts beating the analysts’ expectations. If you’re buying a stock issued by such a company, then rest assured you are buying an overvalued stock.

  • The whole company relies on a single person to move things forward: An example of such a company is Apple (Apple without Steve Jobs will be like a deliciously looking dish without salt – tasteless). What will happen to the stock if the person the whole company depends on is no longer there?

  • The stock is reaching an all time high nearly every month: Although it is nice to see that the stock you are about to purchase is consistently breaking new highs, you have to always remember the saying “what goes up must come down”.

  • The stock price is not factoring in unfavorable market conditions: Let’s assume, for example, that people no longer think that Apple products are cool, or that people start hating Netflix because they just increased their subscription by 60%. If negative market conditions surround the company, then the stock price should definitely drop.

  • The company is getting greedier by the day: Again, let’s take a look at the link to Netflix’s blog, they increased their prices by 60%. Now, while that may have a positive effect on the short term, people will become more disgruntled and Netlfix’s churn rate will skyrocket. Another good example (in the Canadian market) is TD Canada Trust. Me, as well as many other Canadians, are currently very unhappy with the bank sending us a letter every other day or so telling us that they’re increasing their interest rates or the fees (or even creating additional fees)1. Again, TD might go up on the short term, but eventually the churn rate that they will experience will catch up with their greed.

  • The company’s main product is not a serious product: There are many listed companies whose main products or services are not that important, or can be easily cloned. An example of such companies is Youku Inc. Its main product is a YouTube clone that is targeted at the Chinese audience, and that is plagued with copyright violations. There are just too many red flags about this service that makes YOKU way overvalued.

1You should read one of TD’s letters, they are making it look like they’re hiking their fees for our own good!

Note: This article (as well as all other articles on this website) is an intellectual property and copyright of Fadi El-Eter and can only appear on fadi.el-eter.com.
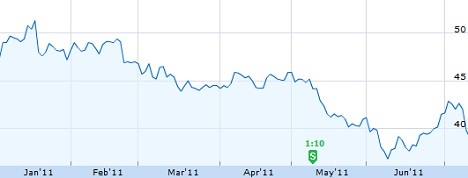
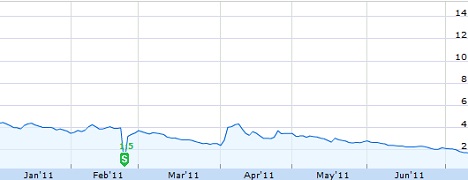
In this current market, we are seeing more and more reverse splits taking place. The latest prominent reverse split was Citigroup’s, which outcome wasn’t (to say the least) impressive. When there’s a reverse split, new investors wonder, is that good for the stock? Is it a good sign?

I’m not going this time to wait until the end of the article to answer this question, so I will answer now: “Generally, reverse splits are a bad sign”.

Now that you know that reverse splits aren’t the best thing that can happen to a stock, you probably need to know why. Well, to explain why, let me discuss first why companies resort to reverse splits.

Reasons for reverse splits

Executives in a company do not wake up one day and decide “hey, we are going to do a reverse split on the stock, we will have less shares and the stock price will be higher”. Usually, there is a valid reason behind a reverse split:

  • The stock has dropped below the $1 level: As per the NYSE and the NASDAQ rules, a stock cannot drop below the $1 level for more than a month. Failing to comply with this rule can cause the stock to be delisted. Companies do a reverse split in order to avoid getting kicked out of the market.
  • The stock is being abused because it’s very cheap: If a stock is very cheap, and the volume on the stock is low, then the stock can be abused by even the smallest investors. If the company does a reverse split on its stock, then the stock will no longer be abused (at least by small investors).
  • Fear from being labeled as a penny stock: Prominent companies, such as Citigroup, refuse to have their stocks labeled as a penny stock, which, in the opinion of many investors, including myself, is any stock trading below $5.
  • Pessimism about the future of the company: If an already cheap stock is in a downward spiral for an extended period (with little hope of going up), then the company may decide to do a reverse split in order to maintain the prestige of the stock (otherwise, the stock may become a penny stock).

As you can see from the above, a reverse split is never the sign of a healthy stock, in fact, it is the sign of a very bad stock, that is stuck in some bearish hell, a stock whose company believes that its chances of going up are very dim.

Still don’t agree with me that a reverse split is bad news? Let’s check a couple of charts:

Figure 1: Citigroup reverse split – The stock is down 13.5% since the reverse split

Figure 1: AIB reverse split – The stock is down 57.7% since the reverse split

So, do you still think that reverse splits are good?

PS: A good question to ponder is the following “Which one of the above reasons did Citigroup and AIB take into consideration for doing the reverse split?”

One of the stocks that I watch most (but I’ve stopped trading since last year) is BAC. Although I have categorized this stock as risky before, I think it is one of the most interesting stocks out there. The pattern is now very clear, the long term downtrend is bearish, and the stock is testing new lows nearly every month.

BAC dropped to a two year low yesterday to $10.35, and is currently trading in the pre-market at $10.18.

Figure 1: BAC down to $10.18 (a new low) or 1.64% in the pre-market (courtesy of Google Finance).

If today proves to be as bad as yesterday for this stock, then expect the stock to reach (yet another) new low and drop below the $10 level. I think there’s an enormous support at that level though, but once tested for the first time, it means that in the very near future, the stock will drop below the $10 level and will stay there for a long, long time. If I haven’t made the decision to no longer be tempted by BAC, I would buy shares at the $10 level, and sell at the $10.50 (because I’m sure the stock will jump at least 5% when it reaches $10 because of all the automatic buy orders).

If BAC remains stuck in this bearish hell, then I wouldn’t be surprised if Bank of America will do a reverse split, similar to the one that C did back in May (by the way, C is down 13% after the reverse split).

One of the common terms in stock trading is the market capitalization or the “market cap”. The market capitalization of a company is, in short, the company’s value as determined by the market.

For example, at this moment, the market capitalization of Apple is $331.39 billion, that of Bank of America is $108.42 billion, that of Citigroup is $122.75 billion, and that of Google is $171.43 billion. Here is a list of the top 100 companies with the highest market capitalization.

The higher the market cap of a company, the more important the company is. However, it is worthy to note that a high market capitalization does not imply a healthy status of the company. Some companies (especially banks) have very high market caps yet they are plagued with different issues that will may haunt them for years to come.

The market capitalization calculation is a very straightforward process, you just multiply the number of shares by the current price of the stock. So the formula would be:

MarketCap = NumShares x StockPrice (where MarketCap is the market capitalization of the company, NumShares is the number of common shares issued by that company, and StockPrice is the price of the stock).

Example on how to calculate the market cap

Let’s look, for example, at Apple’s stock parameters (courtesy of Google finance, as of July 10th, 2011):

Apple’s Stock Information

You can see from the above that AAPL’s price is $359.71, number of shares is 921.28 million. Let’s apply the above formula:

MarketCap = 921,280,000 x $359.71 = $331,393,628,800. In other words, Apple’s market capitalization is billion $331.39, which matches the number in the image above. Note that Apple is the second listed company by market cap.

By looking at the above formula, we can also know the number of shares if we know the market cap and the stock price of a company (which is helpful if the company wants to do a split or reverse split, and wants to set the price of a stock to a specific number), or the stock price if we know the market cap and the number of shares.

July 7, 2011 | In: General

What Are Married Puts?

We all know that the majority of people don’t trade stocks, because they think that:

– Stock trading is a form of gambling
– Stock trading can be very risky

We, stock traders, laugh at the first point, because real stock trading doesn’t just consist of buying a stock and hoping that it’ll go up, it is about making your due diligence before buying the stock, and knowing that it will (most likely) go up, and if it goes down in the short term, then it’ll go up sometime in the future, and if it doesn’t, well, one should accept the loss gracefully and learn from it (incurring a loss is a possibility in any trade in any industry).

As for the second option, yes, stock trading can be risky, but the risk can be limited in many ways. One of these ways is called “married puts”. So what are they?

Let’s say you buy 1,000 shares of C at $42.70 (the current price). Your total cost will be $42,700. You know that Citigroup is bullish on the long term, but you can’t afford to lose a lot on the short term, if the stock goes considerably down. So you buy, at the same time of buying the C shares, “C Aug 2011 43.000 put” at $1.93/share for each share. Your total cost for the puts will be $1,930 (+broker commission). This means that each stock will now cost you around $44.63. But, on the flip side, you have protected your investment until August 19th. So, if the stock goes below $43, you will make money on the puts, if the stock goes above $44.63 you will make money on your stocks. Your loss per share (as long as you have the puts) is only the difference between $44.63 and $43, which is $1.63/share or around 4%. In other words, your total risk is no more than 4% for the next month, and we all know that it’s easy for any stock to move more than that 4% in any one day.

Now let me list both the advantages and disadvantages of married puts.

Advantages of married puts

– Minimal risk in stock trading
– Ability to make money both ways (in our case above, if the stock goes below $43 you will be making money on your puts, and if the stock goes above $44.63 you will be making money on your stocks)
– Peace of mind

Disadvantages of married puts

– Puts expire, and often you can’t get rid of them for a profit before they expire.
– Puts eat from your profits, as they typically increase the cost of a stock by 4% or 5% (depending, of course on the strike price and the expiry date of the put).
– Married puts add to the complexity of stock trading, now you have to take actions when the stock goes up and when the stock goes down.
– Married puts take all the thrill and excitement from stock trading.

Married puts are very convenient, but should be used wisely, and only when you don’t want to take any risk.

Note: This article (as well as all other articles on this website) is an intellectual property and copyright of Fadi El-Eter and can only appear on fadi.el-eter.com.

Probably every investor at the moment is eying the Facebook IPO. Everyone knows that the stock can skyrocket in the first few days and everyone wants to invest and be part of this new social revolution. The “social revolution”, however, is a two edged sword. Revolution always means that there is an imminent change, which means that as long as there is a social revolution, there will always be yet another change in the way people socialize with each other and meet each other.

Let’s look at how people socialized online in the last decade or so:

– Before 2004, people used to socialize on forums.
– Between 2004 and 2006, people socialized online using blogs.
– Between 2006 and 2007, people used websites such as MySpace, Bebo, YouTube, etc… to socialize.
– Between 2008 until now, people used Facebook to socialize casually, and LinkedIn to socialize professionally.

As you can see, people’s moods are constantly shifting. Who can guarantee that people will not use another website/mean to communicate online in 2 years from now, making Facebook and LinkedIn completely obsolete? After all, both of these websites can be cloned, and maybe someone can come up with a clone even better than the original.

Real investors, when purchasing stocks, purchase it on the basis of the future (and not the current) prospects and potential of the company (if you have doubts about this, just take a look on how investors are treating RIM despite its current earnings).

Now let us examine 3 things: How much Facebook is currently earning in revenue, how much will it earn, and how long should it exist just to pay back the investors. By examining these 3 things, we will be able to assess whether Facebook is an attractive investment or not.

In 2010, Facebook earned $1.86 billion. Which is a decent number, considering the inventory of ads consists mainly of spam and some Zynga trash. In 2009, that revenue was around $1 billion. Note that we’re talking here about revenue, and not profits. Profits are around 25% of that number. Which means that in 2010, Facebook made a profit of $500 million, while in 2009, Facebook made a profit of $250 million. In any case, that’s a 100% increase every year. But we all know, that this 100% increase in profits cannot be sustained every year. Let’s assume that Facebook will be able to increase its profits by 20% every year for the next 5 years, and then stabilizing at an increase of 5% year over year (I think this is a very optimistic calculation):

Year Revenue (in million of dollars)
2010 500
2011 600
2012 720
2013 864
2014 1036
2015 1244
2016 13061
2017 1371
2018 1440
2019 1512
2020 1587
2021 1667.
2022 1750
2023 1838
2024 1930
2025 2026
2026 2127
2027 2234
2028 2346
2029 2463
2030 2586
2031 2715
2032 2851
2033 2994
2034 3143
2035 3301

The above table represents Facebook’s very optimistic revenue over the first 25 years, which will total around $48 billion. Let’s assume, to make the calculation easier, that Facebook’s revenue for the first 25 years after the IPO is $50 billion. Several weeks ago, I estimated what will Facebook be worth by comparing it to LinkedIn, and the number was a minimum of $85 billion. Which means that if the growth of 20% over the first 5 years and 5% over eternity is sustained, it’ll take Facebook 34 years to pay back the investors. A bit high, but we’ve all seen worse (LinkedIn has a P/E of over a 2,500!).

Now, we are forgetting one very important thing, Facebook is a website! Even worse, Facebook is a social website! What will happen if in 2 years from now people will start deserting Facebook (if you think that this won’t happen, take a look at myspace, bebo, etc…)? This can easily happen. Facebook by then won’t be worth even a billion. That’s why Facebook’s execs want that IPO, they want the largest amount of money they can get, and they want it fast, because they know that this game will be over at one point or the other. Facebook’s reason to exist is that people like using it at the moment, but we all know they may stop using it at any moment.

So will Facebook be a dangerous stock? Not at the time of the IPO (I think it’ll be much safer than LinkedIn). But you should sell (or even better, sell short) your Facebook shares as soon as you feel that people’s interest in this social network is dropping.

1 As of 2016, year over year increase is assumed to be 5%, as Facebook’s growth will be tamed since everyone that should be on Facebook will be on Facebook by that time.

Note: This article (as well as all other articles on this website) is an intellectual property and copyright of Fadi El-Eter and can only appear on fadi.el-eter.com.

July 1, 2011 | In: General

What Is a Penny Stock?

I never paid attention to all these ads about penny stocks (you know, make 100% of your investment in a week or so), but lately I’m noticing these ads more and more, so I decided to make a small research on penny stocks to know what they are, whether they are a good investment or not, and whether they are a scam or not.

What is a penny stock?

A penny stock is a cheaply priced stock that is listed in any market, but they are more likely to be found on OTC (over-the-counter) markets, where the standards and the financial requirements for companies to be listed are almost negligible.

What is the maximum price of a penny stock?

Technically, a definition of a penny stock is any stock trading below $1 (although there is no official statement by any financial regulator on what is the maximum price of a penny stock). However, many investors state that penny stocks are those stocks that trade below $5. According to these investors, both C (before the reverse split) and SIRI (which was up 4.5% today on more than average volume, hmmm…) are considered to be penny stocks.

Are penny stocks a good investment?

It depends on whether you have some good information about the stock or not. If you do, then there’s a huge possibility that you will make a substantial amount of money, but then again, if you don’t have any information, or even worse, you are misinformed, then expect to lose a lot of money.

Are penny stocks a dangerous investment?

Unless these stocks are traded in the NYSE or the NASDAQ (by the way, if you want to adopt the definition of a penny stock which states that it’s any stock that is below $1, then bear in mind that both the NYSE and the NASDAQ will delist a stock that trades below a $1 for more than 1 month) then yes, penny stocks are very dangerous. The swings, in either way, can be very high. Sometimes penny stocks trade for 2 cents, so 1 million shares per trade would only cost the investor $20,000, but that would create a huge volume.

What are the advantages of penny stocks?

There are a couple of advantages to penny stocks:

  • Potential to make a lot of money if you are well informed (which tends to happen mostly if you work inside the company issuing the stock).
  • Ability to buy a lot of shares for very little amounts.

What are the disadvantages of penny stocks?

There are many disadvantages to penny stocks, including:

  • Most of these stocks are scams. Unless these stocks are trading in the main markets (NYSE, NASDAQ, or AMEX), then the possibility of them being a scam is quite high. This is because regulations in OTC markets are quite lose, so someone could just list a stock there under a fictional company, make some buy/sell trades on the stock to make it seem as if there is movement in order to attract (not so smart) investors.
  • Penny stocks are dangerous stocks. As stated earlier, the swings in these stocks are high, often too high. For example, a 2 cent stock goes up 50% when it goes up only 1 cent (and it goes down 50% if it goes down just 1 cent). This is just too dangerous, at least for my taste.
  • Penny stocks can just disappear. As I said before, there are no strict standards for companies to be listed in OTC markets. So, a not-so-strong (if not fictional) company may go bankrupt one day, and you may lose all your investment (if you consider it an investment).

Someone recommended to me several penny stocks listed on the Canadian market, all of the stocks he recommended went up, but again, this thing is just too sour for my taste, and I don’t trust stocks that are issued by companies that do not meet the criteria to be listed in real markets. I would never ever recommend a penny stock listed on the OTC markets.

June 26, 2011 | In: Technology

Is LNKD a Buy?

I have discussed LinkedIn (NYSE:LNKD) a couple of times before: the first time it was before the IPO, and the second time on May 20th, the same day of the IPO.

The first time I discussed LinkedIn I estimated that its market cap will be anything between $1 billion and $10 billion, and that a fair market cap for LinkedIn will be between $3 billion to $5 billion. The second time I (mistakenly) stated that the stock can still go up by another 50%, but I stated that I was very skeptical of the stock’s price above the $100 level.

Fast forward a month from then, and now the stock is trading at $70, which is only 57% of the stock’s all time high price of $122.70. It seems that the jig is up! At a P/E of just below 2,000, most investors probably saw this coming, and I’m sure we haven’t heard the end of it. The stock will continue its decline until there is at least a remote relationship between the stock’s price and the company’s fundamentals. As I stated before, LinkedIn is not an essential website, and on top of that, it can be easily cloned. LinkedIn, in my opinion, is just another website, that happens to get a lot of traffic, and that media was able to hype well enough to attract average thinking investors into buying it at a very, very high price. Remember all those articles about LinkedIn prior to the IPO? How LinkedIn is going to change the concepts of professional networking and job hunting? Now that we are way past the IPO, it is very rare to find any website even slightly praising LinkedIn and its business model.

In my opinion, LinkedIn’s business model is very delicate, and can be easily crushed by a competition offering a better system (regardless of how many visitors LinkedIn currently has). LinkedIn is a very risky (if not dangerous) stock at this price, and should be avoided at all costs, you can buy it if you want, but think about it this way, what are you exactly investing in? Just think about all the potential risks (Unfortunately, I just can’t see any real intrinsic value in this company to list at least one reason of why investors should buy this stock):

  • A competitor creates a better website that will steal users from LinkedIn (Facebook, perhaps?).
  • LinkedIn gets blocked in some countries for privacy reasons (the same as with RIM).
  • LinkedIn’s traffic goes down. For example, users start losing interest in the website or Google decides to lower the importance of LinkedIn in its search results.
  • Institutional investors start getting out of the stock, because of the very high P/E.
  • LinkedIn is unable to meet the market’s expectations. I think investors will see this in action very soon, when the first earnings report is out! Everyone will see how out of whack the stock price with the earnings of the company.

My advice to any investor on this planet, avoid LNKD, it’s a bad investment. The company didn’t need to have an IPO in the first place, they just did it because the executives wanted to fill their pockets. It’s as simple as this.

Small investors always want to know which stocks the “big” investors own. And who’s a bigger investor than Warren Buffet? Warren is a legend in Wall Street, who, according to his story, started his multi-billion investment empire with only a few thousand dollars.

Anyway, here are the top 10 stocks that are currently owned by Warren Buffet through his company, Berkshire Hathaway INC. This list is very recent.

Company Symbol # of Shares Cost1 Price2 Market Value
The Coca-Cola Company KO 200,000,000 6.49 64.93 12,986,000,000
Wells Fargo & Company WFC 358,936,125 22.32 27.26 9,784,598,767
American Express Company AXP 151,610,700 8.48 48.34 7,328,861,238
The Procter & Gamble Company PG 72,391,036 6.41 62.59 4,530,954,943
Kraft Foods Inc. KFT 97,214,584 32.98 34.60 3,363,624,606
Johnson & Johnson JNJ 45,022,563 61.05 65.06 2,929,167,948
ConocoPhillips COP 29,109,637 69.66 71.43 2,079,301,370
Wal-Mart Stores, Inc. WMT 39,037,142 48.49 52.41 2,045,936,612
U.S. Bancorp3 USB 78,060,769 30.75 23.92 1,867,213,594
POSCO3 PKX 3,947,555 194.55 104.05 412,519,497

Note: There are a few stocks that are not traded in any of the main US markets (such as the BYD Company and Munich RE), I have removed them.

1 This column represents the average cost per share for Berkshire Hathaway, in other words, the actual purchase price.
2 The current market price of the stock.
3 Stocks highlighted in red are those stocks where Berkshire Hathaway is currently at a loss.