June 25, 2011 | In: Trivia

What Is Airbus Stock Ticker?

I just learned today that Air Asia ordered 200 Airbus 320 planes. Apparently, the deal was closed 2 days ago (June 23rd, 2011). Immediately, I wanted to know what Airbus stock ticker is, just to see how much the stock has jumped for this huge order (which, according to many sources, is the largest order made by any company for commercial airplanes, and is worth $15.6 billion).

To my surprise, I couldn’t find any Airbus stocks listed (I searched on Google finance). After a small research, I discovered that Airbus falls under a Dutch company called “European Aeronautic Defence and Space Company“. The company is listed under Euronext Paris, a European stock exchange, and its stock symbol is EAD.

EAD was only up 3% since the deal was made public, which is not much, since EADS market cap is only $18.30 billion (I think the stock should have gone up way more, again, the deal is for $15.6 billion.)

I think I’ll watch EAD for the next couple of months, although I cannot trade it (I can only trade stocks listed in Canadian and US markets).

In my article about negative betas, I have briefly explained what a beta, in the stock market, is. In short, the beta is the movement of the stock with respect to the stock market. So the higher the beta is, the better (in theory) the stock is. On the short term, a beta is an excellent measurement that can be used to assess stocks, and a high beta is considered to be a characteristic of a good stock (but also on the short term, that’s why the beta was mentioned in that article).

I have decided to put a list with the top 100 stocks with the highest beta, listed in both the NASDAQ and the NYSE. The data is gathered using both Google Finance and Yahoo Finance (so it’s pretty accurate). No PINK or OTC stocks are listed below.

Rank Company Stock Symbol Beta Volume Last Trade
1 Cell Therapeutics CTIC 5.78 2365040 1.99
2 China Eastern Airlines CEA 5.08 35789 21.44
3 Sunrise Senior SRZ 5.04 1242970 8.90
4 Pier 1 Imports PIR 4.62 2210820 11.39
5 Beazer Homes USA BZH 4.39 1859100 3.32
6 Human Genome Sciences HGSI 4.22 2207280 24.91
7 Bank of Ireland IRE 4.21 4223450 1.11
8 LodgeNet Interactive LNET 4.21 190465 3.28
9 Arbor Realty Trust ABR 3.95 65528 4.60
10 Kemet Corporation KEM 3.94 535054 13.92
11 Ruby Tuesday RT 3.87 948728 10.55
12 Select Comfort SCSS 3.87 1078480 17.04
13 Dollar Thrifty DTG 3.82 668788 73.07
14 MGM Resorts MGM 3.82 21022900 12.20
15 Perfumania Holdings PERF 3.78 1969 15.89
16 General Growth Properties GGP 3.77 4886770 16.11
17 Entegris, Inc. ENTG 3.69 1447370 9.78
18 Unisys Corporation UIS 3.68 546988 24.37
19 Oclaro, Inc. OCLR 3.67 1626190 6.04
20 American International Group AIG 3.66 12736900 28.45
21 Sonic Automotive SAH 3.66 707483 13.94
22 Dendreon Corporation DNDN 3.61 3264060 38.65
23 Newcastle Investment NCT 3.6 1466320 5.55
24 FelCor Lodging Trust FCH 3.56 1530380 5.21
25 Zanett Inc. ZANE 3.56 29298 0.65
26 Phoenix Companies PNX 3.55 482012 2.32
27 Charming Shoppes, CHRS 3.51 1373640 3.94
28 Boise Inc BZ 3.5 2369370 7.08
29 Century Aluminum CENX 3.46 1908520 14.22
30 PMI Group PMI 3.42 4536310 1.22
31 Meritor, Inc. MTOR 3.42 1640210 14.90
32 TRW Automotive TRW 3.41 1373520 57.02
33 Ion Geophysical IO 3.38 1911970 8.18
34 CBL & Associates CBL 3.36 1469200 17.61
35 Keryx Biopharmaceuticals KERX 3.35 1447740 4.62
36 Belo Corporation BLC 3.34 1173620 7.25
37 Commercial Vehicle Group CVGI 3.34 185477 13.32
38 Ferro Corporation FOE 3.31 1058710 12.31
39 Sify Technologies SIFY 3.31 2850520 4.39
40 Office Depot ODP 3.3 8625500 4.17
41 Tenneco Inc. TEN 3.28 860658 42.10
42 Casual Male Retail Group CMRG 3.27 188851 4.12
43 Valassis Communications VCI 3.25 769034 28.34
44 McClatchy Company MNI 3.24 1149540 2.63
45 Miller Energy MILL 3.23 358458 6.55
46 Rediff.com India REDF 3.22 1921300 8.90
47 Zale Corporation ZLC 3.21 732171 5.67
48 Photronics, Inc. PLAB 3.16 988545 8.07
49 Genworth Financial GNW 3.14 5488550 9.95
50 National Financial Partners NFP 3.13 278800 11.51
51 Central European Media Ent. CETV 3.11 344022 19.16
52 Journal Communications JRN 3.1 158677 5.00
53 Sanmina-SCI SANM 3.07 866177 9.26
54 MarineMax, Inc. HZO 3.06 99635 8.42
55 Brunswick Corporation BC 3.04 1564950 19.01
56 Hartford Financial HIG 3.04 4193790 24.72
57 LIN TV TVL 3.04 161878 4.62
58 MGIC Investment MTG 3.04 4344870 6.04
59 Marshall Edwards MSHL 3.04 57994 0.9999
60 Jones Group, Inc. JNY 3.01 1520990 10.37
61 Protective Life PL 2.98 581385 21.89
62 Carmike Cinemas CKEC 2.98 143155 6.99
63 Nautilus, Inc. NLS 2.97 160805 1.64
64 Oriental Financial OFG 2.96 201227 11.57
65 RAIT Financial Trust RAS 2.95 2223330 2.09
66 Hovnanian Enterprises HOV 2.95 2093280 2.00
67 Entravision Communication EVC 2.94 121128 1.83
68 Greenbrier Companies GBX 2.94 603372 19.80
69 Finisar Corporation FNSR 2.94 4213110 16.06
70 Renesola Ltd. SOL 2.93 3860360 5.04
71 Radian Group Inc. RDN 2.92 3847030 3.92
72 Royal Caribbean RCL 2.92 3093060 36.21
73 Gray Communication GTN 2.91 319622 2.44
74 MGP Ingredients MGPI 2.91 33095 8.25
75 Principal Financial PFG 2.9 2196410 29.01
76 Asbury Automotive ABG 2.89 399402 17.31
77 Powerwave Technologies PWAV 2.88 2578330 2.84
78 ValueVision Media VVTV 2.86 599638 7.93
79 iStar Financial SFI 2.85 1039800 7.42
80 BioLase Technologies BLTI 2.85 697158 5.52
81 Brigham Exploration BEXP 2.85 3303960 26.89
82 Ashland Inc. ASH 2.82 862488 62.29
83 Tuesday Morning TUES 2.82 219720 4.35
84 A.H. Belo AHC 2.8 89065 7.49
85 ING Group ING 2.77 2060240 11.12
86 Allied Irish Bank AIB 2.76 1360070 2.13
87 LaSalle Hotel LHO 2.76 797794 25.25
88 Lee Enterprises LEE 2.76 1209340 0.8168
89 Orient-Express Hotel OEH 2.75 608903 10.04
90 Textron Inc. TXT 2.75 4006700 22.36
91 GRUMA GMK 2.74 17362 7.60
92 Gaylord Entertainment GET 2.73 617209 29.25
93 Gramercy Capital GKK 2.73 619360 3.02
94 Dynavax Technologies DVAX 2.73 857291 2.73
95 Goodyear GT 2.72 7141400 15.88
96 ATP Oil & Gas ATPG 2.71 1410100 14.67
97 Impac Mortgage Holdings IMH 2.69 22508 2.95
98 Louisiana-Pacific LPX 2.69 2198770 8.14
99 Manitowoc Company MTW 2.69 2617950 15.34
100 Hudson Highland HHGP 2.69 90033 5.01

By looking at the above list, we remark 2 things:

– The stock with the highest beta is a pharmaceutical stock. In my opinion, the pharmaceuticals industry is one with a very high volatility when it comes to stocks.
– The stock with the second highest beta is in fact the stock of a Chinese company. I’m wondering if with all the current attacks on Chinese listed companies in the US markets this stock will remain at the top of the list.

Note: The above data is only valid at the time of publishing. Betas, as with everything else in the stock market, are not constants.

I have talked about Greece, Europe, and the Euro a few times before. I have discussed how Greece is affecting the whole European market (and the American one as well), how Europe is becoming nothing more of another Chinese colony, and how the death of the Euro is imminent. But when will it be?

Let us examine what’s going on in different parts of Europe, particularly the PIIGS countries (Portugal, Ireland, Italy, Greece, and Spain):

– Portugal wants some tougher austerity measures: As if the previous measures weren’t enough, the new Portuguese government wants to make them tougher. I don’t see the Portuguese revolting, after all, they lived under a communist dictator for a long, long time.

– Ireland’s economy is in freefall: Yes, check the Irish banks, notice the very bearish trends. That country’s economy is going nowhere. Someone, somewhere, decided that Ireland is no longer exemplary when it comes to economy. Not only that, the Irish are now remembering, again, that there is Northern Ireland (if you get my point).

– Italy’s economical problems are no better than Ireland’s: But it’s not the time right now to unveil the horrors of what’s going on there, economy wise. Just today, the spread between the Italian and the German 10 year bonds reached a new record since the Euro was created. Not to mention, of course, Italians are much more like the Greeks when it comes to loving life, and hating large organizations that control their lives (in other words, the government).

– Greece is currently being bailed out for the hundredth time: Which means more austerity measures to the life-loving Greeks. I don’t know how much longer they can wait before moving back to drachmas. But the question is, can they move back to their original national currency? Currently, the European Union is giving more and more loans at exorbitant rates in Euros, maybe to enslave them. The problem is that Greece will never be able to pay its debts, at one point, the Greeks will truly revolt and there will be nothing that can stop them. Some are suggesting that the only solution to solve the Greek problem is to sell some state assets such as historical landmarks and islands. Imagine the Acropolis with a German flag flying over it.

– Spain’s having a constant barrage of protests: And these protests are just the beginning. You can’t expect to enforce austerity measures on a population that have just started enjoying prosperity.

So, when do I think the Euro will collapse? Not this year, maybe next year, and if not, then definitely in 2013. By then the Germans, the French (whose economy may soon be in trouble), the Portuguese, the Irish, the Italians, the Greeks, and the Spanish will discover that they’re not the same people, they don’t have the same interests, they have different lifestyles, and they don’t want to be bound together by this one currency, that nobody seems to like anymore.

It was good that the Europeans created the Euro, so that the whole world knows that the USD is the only real international currency in this world.

By the way, do you know that the word Europe (of which the word Euro comes) originally refers to the Phoenician princess Europa, who, according to the Greek mythology, was seduced by Zeus? So I guess the Europeans do owe something to the Greeks!

June 24, 2011 | In: General

Days to Cover Calculation

The days to cover, also referred to as short interest ratio, is the number of days that it takes for all short shares to be covered (e.g. bought back by the investor to return them to the borrower), based on the daily average trading volume of the stock. Days to cover is an important metric to see if the stock is vulnerable to a short squeeze.

Here’s the formula to calculate the number of days to cover:

DTC = TNSS / DAV (where DTC = days to cover, TNSS = Total Number of Shares Short, DAV = Daily Average Volume)

Let’s look at YOKU, a dangerous stock. YOKU has an average volume of 3.6 million shares/day and has 9.04 million shares that are short. According to the formula above:

Days to Cover = 9.04 / 3.6 = 2.51

This means that it will take all investors who have shorted the stock 2.51 days to buy back the YOKU shares that they borrowed, provided that all the trading in the stock consists of shorters covering.

Why is the number of days to cover important?

The number of days to cover is indicative of the potential of a short squeeze, the higher the number of days to cover, the higher the possibility of a short squeeze (they are proportional to each other). In the case of YOKU, the situation is not that horrible. But imagine a stock with short interest ratio of 40 (i.e. number of days to cover is 40), in case the stock goes up and shorters decide to start covering, then it’ll take 40 days to reduce that short interest ratio to 0, and since the stock has already a normal daily volume of its own, the volume will be double for these 40 days. So, for 40 days, you will have a lot of buying at double the volume, which will make the stock soar (the stock can go up 100% easily in this case meaning a lot of loss for shorters).

In short, avoid to short stocks that have a high interest ratio, or risk the chance of being burned if the stock suddenly reverses the trend.

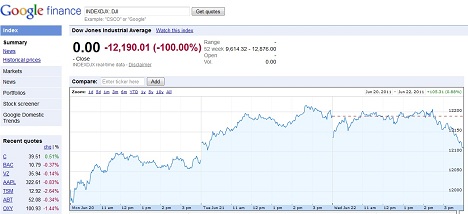
According to Google Finance, the Dow is currently trading at 0 (down 12,190 points), which effectively means that the stock market has she all its value in one trading day, and all companies listed under the Dow are completely worthless. If you don’t believe me, take a look at the image below:

Figure 1: Dow Jones Industrial Average Is Now 0 (down 100%) According to Google Finance (click to enlarge)

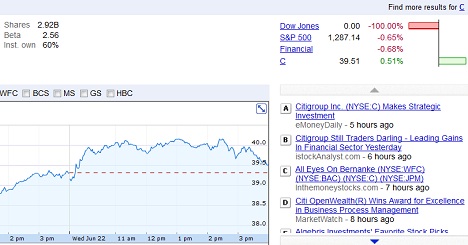
And here’s a second picture (in case you don’t believe me) showing the index on the top right:

Figure 2: Dow Jones down 100% on Google finance – 2nd picture (click to enlarge)

GOOG, on the other, is trading at $487.01, down $6 or 1.22%. By looking at the value of the Dow, I guess Google is doing very well!

Of course, this is a glitch (which I saw around 5:45 PM EST today), but it’s a scary glitch. Come on Google!

PS: The above photos are not altered using Photoshop or other tools, they’re 100% genuine.
PSS: Google now fixed the problem, apparently the Dow was only down 80 points, phewww…

I’m am enjoying these lists that I’m creating every now and then. Compiling them is becoming more fun by the day, and it seems that my readers like them as well. Today I am listing the top 100 companies (that are publicly traded in the US markets) by market capitalization. I always thought that Apple was the largest company by market cap, but it seems that I was wrong. Here’s the list:

Rank Company Name Market Cap Stock Symbol Stock Price
1 Exxon Mobil Corporation 395.1B XOM 80.21
2 Apple Inc. 303.9B AAPL 328.59
3 Telefonos de Mexico 292.3B TFONY 16.17
4 PetroChina Company 262.3B PTR 141.79
5 Hitachi, Ltd. Company 261.6B HIT 57.93
6 BHP Billiton Limited 251.5B BHP 90.42
7 Petroleo Brasileiro 216.0B PBR 33.11
8 Microsoft Corporation 208.5B MSFT 24.72
9 BHP Billiton plc 208.1B BBL 74.80
10 Chevron Corporation 204.8B CVX 101.89
11 IBM 201.1B IBM 166.03
12 General Electric 199.0B GE 18.762
13 Petroleo Brasileiro 196.4B PBR-A 30.115
14 Berkshire Hathaway 188.9B BRK-A 114335.00
15 Wal-Mart Stores 184.1B WMT 53.01
16 AT&T Inc. 183.7B T 31.015
17 Johnson & Johnson 182.5B JNJ 66.56
18 China Mobile Limited 179.9B CHL 44.83
19 Procter & Gamble 178.7B PG 64.02
20 HSBC Holdings, plc 171.3B HBC 48.88
21 Oracle Corporatiotion 163.6B ORCL 32.33
22 JP Morgan Chase 162.9B JPM 40.99
23 Pfizer, Inc. 161.0B PFE 20.38
24 Google Inc. 158.2B GOOG 490.96
25 Coca-Cola Company 151.8B KO 66.30
26 Wells Fargo 145.5B WFC 27.50
27 Vodafone Group Plc 138.7B VOD 26.62
28 Novartis AG 138.6B NVS 60.64
29 BP p.l.c. 135.3B BP 43.12
30 Rio Tinto Plc 134.7B RIO 68.72
31 Toyota Motor 127.0B TM 81.01
32 Total S.A. 124.7B TOT 55.72
33 Siemens AG America 117.0B SI 133.85
34 Citigroup, Inc. 115.8B C 39.65
35 Schlumberger Ltd. 114.1B SLB 84.09
36 Intel Corporation 113.9B INTC 21.48
37 Bank of America 109.9B BAC 10.84
38 Merck & Company 109.9B MRK 35.595
39 Pepsico, Inc. 109.0B PEP 68.95
40 Telefonica SA 108.4B TEF 23.96
41 GlaxoSmithKline 105.7B GSK 41.55
42 ConocoPhillips 104.6B COP 74.03
43 CNOOC Limited 103.8B CEO 232.37
44 Banco Santander 103.0B STD 11.56
45 Verizon Communications 101.6B VZ 35.92
46 Cmp. de Bebidas das Americas 101.0B ABV 32.53
47 America Movil 101.0B AMX 50.67
48 Sanofi American 99.488B SNY 38.12
49 China Life Insurance 91.761B LFC 48.35
50 Unilever NV 90.896B UN 32.35
51 Anheuser-Busch Inc. 90.865B BUD 57.04
52 Unilever PLC 90.165B UL 32.09
53 QUALCOMM Inc. 90.155B QCOM 54.00
54 ING Groep NV 89.338B INZ 23.62
55 ING Group, NV 88.052B IND 23.28
56 Amazon.com, Inc. 87.579B AMZN 193.74
57 Ecopetrol S.A. 86.712B EC 42.85
58 McDonald’s Corportion 85.725B MCD 82.62
59 Cisco Systems, Inc. 85.528B CSCO 15.55
60 ING Groep NV 83.740B ISP 22.14
61 ENI S.P.A. 83.662B E 46.19
62 Occidental Petroleum 83.385B OXY 102.58
63 ING Group, N.V. 83.131B ISG 21.97
64 Abbott Laboratories 81.320B ABT 52.32
65 China Petroleum 81.292B SNP 93.58
66 Royal Bank Of Canada 81.092B RY 56.50
67 Statoil ASA 78.556B STO 24.68
68 United Technologies 78.172B UTX 85.41
69 Banco Bradesco 74.267B BBD 19.43
70 NTT DOCOMO 73.854B DCM 17.81
71 Hewlett-Packard 73.259B HPQ 35.32
72 Toronto Dominion Bank 73.077B TD 82.47
73 Walt Disney Company 72.960B DIS 38.60
74 SAP AG ADS 72.956B SAP 61.38
75 Comcast Corporation 71.423B CCT 25.82
76 Goldman Sachs Group 70.381B GS 135.94
77 United Parcel Service 70.366B UPS 71.35
78 UBS AG Common 69.256B UBS 18.21
79 Westpac Banking 68.546B WBK 114.74
80 Astrazeneca PLC 68.204B AZN 49.28
81 Novo Nordisk A/S 68.009B NVO 118.98
82 Taiwan Semiconductor 67.636B TSM 13.05
83 Comcast Corporation 66.416B CMCSA 24.01
84 3M Company 66.247B MMM 93.23
85 Caterpillar, Inc. 65.936B CAT 102.31
86 Bank Nova Scotia 64.721B BNS 59.80
87 Comcast Corporation 63.235B CMCSK 22.86
88 Nippon Telegraph 62.822B NTT 23.74
89 Kraft Foods Inc. 61.174B KFT 34.80
90 Suncor Energy 60.901B SU 38.71
91 American Express 59.735B AXP 49.69
92 ABB Ltd 58.172B ABB 25.47
93 Canon, Inc. 57.124B CAJ 46.50
94 Altria Group, Inc 57.003B MO 27.23
95 UnitedHealth Group 56.891B UNH 52.51
96 Home Depot, Inc. 55.904B HD 35.11
97 France Telecom 55.427B FTE 20.92
98 Deutsche Bank AG 55.037B DB 59.48
99 EMC Corporation 54.814B EMC 26.64
100 Boeing Company 54.010B BA 73.15

As you can see, the company with the largest market cap is (surprise surprise!) EXXON, an oil company. With a market cap of almost $400 billion, I don’t see EXXON being surpassed by market cap anytime soon, even by Apple (AAPL needs to be trading at $429 to surpass XOM and become the company with the largest market cap, assuming that XOM keeps trading at the same price of $80.21).

It’s interesting that a lot (if not most) companies in the above list are not US companies (Just look at the top 5).

Note #1: This list is valid at the time of publishing. As well all know, the market cap of any company changes every trading second!
Note #2: Telefonos de Mexico is listed in Yahoo (where the data comes from) as having a market cap of $292 billion, while it’s listed on Google finance as having a market cap of just over $10 billion. Don’t know what the real story of this stock is. Same goes for other companies, such as Hitachi.
Note #3: Some companies, such as Petroleo Brasileiro, are listed more than once, because they are trading under different stocks.

Many stock investors think that it’s impossible for a stock to have a negative beta, that all stocks should move with the direction of the general market, and the first time they see a stock with negative beta, they are amazed, and they start asking questions to fellow investors on whether this is possible and how it can be possible.

In this post, I will answer this question, but first let me explain what beta, in the stock market world, means.

Beta is a metric that corresponds to the movement of a certain stock with respect to the market. Let’s look at AAPL, for example. AAPL has a beta of 1.34. Let’s assume that the stock market as whole, has a 5% expected return. Ignoring interest rates and other factors, this means that AAPL’s return on the investment will be 1.34 x 5% = 6.7%

Now, obviously, when there is a negative beta the whole thing becomes confusing. But let’s look at a couple of stocks that have negative beta:

HOD (goes up when oil goes down)
HND (goes up when gas goes down)

As you can see from the above, both stocks are bearish stocks, they proportionally move with the inverse of the market. So, if the market goes up, they go down, and vice versa, and if you notice both HOD, and HND have negative betas (-2.78 and -0.33, respectively). Let’s now take HOD as an example to make the same calculation that we did with AAPL. If the market has a return of 5%, then HOD should return -2.78 x 5% = -13.9%. However, if the market has a return of -3%, then HOD should return -2.78 x -3% = 8.34%. You see, HOD started yielding positive return when the market was down.

In conclusion, yes, a stock can have a negative beta, and this usually means that the stock is one of those reverse ETFs.

First, I want to say before starting this article that I am not short on RIMM. I don’t have any long or short position in RIMM, and nor do I intend to (at least at the current price level).

There is a lot of gossip at the moment that RIM (Research In Motion), at the current price level, is now a takeover target. So, is this really true? Will RIM accept that another company buys it? Is it better for RIM to be bought by another company? And finally, which company can afford RIM at the current market cap of 13.60 billion (at the time of writing – at the current rate, maybe by the time I finish this article the market capitalization of the company will be down to $13 billion).

Is it true that RIM is a takeover target?

No, it’s not. Not a single company has expressed interest in RIM or its technology (especially its soon-to-be-obsolete BBM service). Reasons of why there is no offer yet may include:

  • Large companies are waiting for a better entry point. At over $13 billion, RIM would still considered heavy on their balance sheets.

  • Belief (and rightly so) that the BBM service will soon be obsolete and can easily be cloned.

  • Not seeing any value in RIM’s hardware.

  • The Legal issues that RIM is facing (especially those dealing with security/privacy in developing countries), and that the company that will buy RIM will face (including being accused of a monopoly in case it’s an established telecom company).

Will RIM accept a buyout offer?

That’s a very important question. We all know how stubborn and arrogant RIM’s founders are. They saw what’s coming years ago, and yet they didn’t even budge, they didn’t make any action to adjust their strategies to better integrate their products and their services in this ever connected world. They wanted (and still want) to keep the technology closed, and they keep on ignoring all the material signs that what they’re doing will be no longer relevant in a couple of years. In short, they refuse to change (that’s a main characteristic of a stubborn person). Obviously, they couldn’t care less about their investors, but the question is, do they care about their pockets? If they leave the company as is then they will soon (we’re talking in less than a year) go from profitability to loss, which means that they will no longer be able to make the money that they used to make. Selling RIM will ensure that they get out while they still can, while they’re still making money, a lot of money. Now even if they accept a buyout offer, the problem is that RIM is a Canadian company, and when it comes to huge buyouts like these, the Canadian government has a saying in the decision, and may block it, if it is deemed (by the Canadian government) that the deal will not provide a net profit for Canada (Canada is not equal to RIM). For those of you thinking that this is just chit-chat and the Canadian government will never do this, I want to assure you that it may very well will (wow, well will!). In fact, the Canadian government blocked a huge buyout deal last year, when BHP Billiton wanted to buy Potash Corporation of Saskatchewan.

Is it better for RIM to be bought?

Yes, It’s better.

  • It’s better for the investors: All the knowledgeable investors know that RIM, as a standalone company, has no future whatsoever. For them, it’s definitely better to see RIM bought than to see their stocks trading in single digits. For some investors, when the stocks start trading at the single digits (and they will, if the company doesn’t get bought) their initial investment in RIM will be just a fraction of what they originally bought the stock at.

  • It’s better for Canada: RIM is becoming more of a liability than an asset to Canada. There are top government officials traveling to distant countries every now and then trying to address security and privacy concerns. Additionally, in case RIM goes bankrupt, there will be thousands of jobs (we’re talking about 17,500 jobs here) that will be lost. Better to save a few thousands of these jobs than to lose them all.

  • It’s better for top management: As I pointed out above, management should have no interest keeping the company if they don’t want to change its main business objectives. No sane management should stay in a company to witness its transition from profitability to loss if they are offered the chance to get out at profitability.

Which companies can afford (and can see benefit) in RIM?

Even at $13 billion, there are many companies that can afford RIM, including:

  • Google: With its strong cash reserves and large market cap, Google is an important candidate that may consider buying RIM. But why would Google do this? Well, it’s obvious that Google is always on the hunt for new investments and expansions in the mobile market (Google strongly believes that the future is the mobile), and buying RIM will be considered as a great investment for Google. Google will be able to integrate the BBM with Android, which will leave Apple with no other option but to join the bandwagon and allow BBM on its phones as well.

  • Apple: With zero debt, a strong foothold in the mobile market, and probably the largest cash reserve of any US company, Apple is, in my opinion, the strongest candidate to buy RIM. Buying RIM will give Apple near absolute control of the smartphone market (which is probably one of Steve Jobs’ fantasies). However, I seriously doubt that Apple will be interested in buying RIM for that reason alone (and that’s why I listed it as number #2, after Google).

    Microsoft:: Microsoft is always desperate to get into the mobile world, and every time it does get in, it is faced with a disgraceful defeat and gets out. How many of your friends have the Windows Phones or have a Phone with a Windows OS? Figured so! One of the other reasons that Microsoft would want to buy RIM is because Google wants to buy it as well (Microsoft seems to want anything that Google wants). I think that if Microsoft buys RIM, then it will be the absolute end of all RIM’s products, as Microsoft’s bureaucracy and slowness in decision making is worse than the worst government’s agency.

    Mobile carriers: Mobile carriers such as AT&T and Verizon (Note: Sprint can’t afford it) would definitely be interested in buying RIM. They have the cash to do it, and they obviously would benefit from the deal. However, since nearly all mobile carriers provide the blackberry service on their networks, I’m not sure how they will react when one mobile carrier (AT&T, for example) buys RIM, will they still continue to run the service? Or would they cancel it just because they refuse to directly benefit that mobile carrier (after all, nobody wants to strengthen his competition)?

Again, no buyout offer will happen until the dust settles, which may happen somewhere around the $20 mark (or maybe a P/E of 3 – which is very, very attractive). And when this happens, you will see all the above companies scavenging on RIM, or what’s left of it. This is sad, but what’s even sadder is that this is all the result of the absolute stubbornness of two individuals.

Unless you’ve been living under a rock for the last couple of months, you know that RIM, as a company, is facing some serious issues. RIM is becoming more and more irrelevant in today’s world, and is losing market share by the second. RIM may even go bankrupt in case its executives do not change direction and do not simply wake up.

Today RIMM (trading at $27.81, down $7.52 or 21.29% at this very moment) was slaughtered on extraordinary volume (10 times the average volume, which means that stock is gone). In my opinion, it is already too late for RIM’s management to take any action to salvage the company. In fact, any action taken now will be just to artificially pump up the value of the stock, and not save the company (like laying off thousands of employees, for example). RIMM will probably be trading in single digits (e.g. less than $10) by the end of the summer (at this point it can be an easy takeover target, perhaps by Apple). I am confident that RIM, as a company, is far beyond redemption.

I was just thinking, could Google face the same fate? Here’s why I’m saying this:

– Google has been trying to imitate Facebook the same way that RIM was trying to imitate Apple.
– It’s been a long time that Google has offered anything new when it comes search engine intelligence (the same way with RIM not doing anything new with its service).
– Google is undertaking ventures that are mostly flops, the same way that RIM is creating clumsy products that are getting poor reviews and reception by the public.
– Google has shifted management at the top level to respond to competition, replacing the previous CEO (who is now already a scapegoat) with a technical person who is clearly an introvert.
– Google is losing traffic to Facebook, the same way RIM is losing market to Apple and Android Phones.
– Google will soon face some serious competition in the online advertising world from Facebook, as the Facebook can display much more targeted ads than Google.

Of course, Google has still a lot of tricks in its pockets, it is still the most visited website in the world, and is the 4th most respected brand in the world, and the 1st most respected brand online. Not to mention, of course, that Google is sitting on a ton of cash.

But all that won’t matter, because Google now is doing all the wrong things that destroyed RIM and ignoring all the right things that made Google (innovation, being always ahead of the competition, not being evil, etc…).

Just think about it, Google’s only asset right now is its superior search engine, but what if Facebook comes up with a better (or even similar) search engine technology. Will Google be still relevant? Why would people go to Google if they can do everything from Facebook?

Google’s situation is at best awkward at the moment, and the investors know it: GOOG is down 18% so far this year.

GOOG chart for the last six months (since the beginning of the year)

Will Google survive? Maybe, but it takes a lot of luck, a lot of screw ups on Facebook’s side, a lot of work, and a lot change in Google’s corporate mentality. I don’t want to see Google die, neither anyone else that I know of, for that matter. I love Google and I hope that they will be able to make it through the storm, which hasn’t even started yet.

Meanwhile, if you’re using Google, try to search for “Should p” and here’s what you’ll most likely see:

Google should p…

June 17, 2011 | In: General

Is Shorting Stocks Illegal?

When I first learned about the practice of shorting stocks, I was surprised that it was allowed. Investors can literally reduce the stock price to a fraction of what it was when they heavily short it, this is because when you short a stock, you’re actually borrowing (not buying) the stock from your broker, and selling it immediately in the market, which means you are performing a sell trade, which increases supply of the shares of the particular stock you’re selling, ultimately reducing the price. Not only that, when other (shall I say “fellow”) investors notice that a stock is being shorted and is an downtrend, then they start playing the same game as well, which will reduce the price of the stock further, making the bearish trend of the stock even harder to break.

Although heavy shorting can have devastating effects on a stock, it’s not illegal. However, naked shorting is…

What is naked shorting?

Before I continue writing, I have to stress the point that if you don’t know what short selling is, then this is the only place where you will be able to understand what it really means – everywhere else the definition is copied as is (or with little modification) from the SEC, and we all know how good the SEC people are at explaining market terms for the layman.

Anyway, As explained above, when you short a stock, you’re actually borrowing it from your broker, and then trying to sell it immediately on the market. Now, when you’re selling a stock, this means that there is a buy transaction happening (for every sell there is a buy, and vice versa), but what if you didn’t even borrow the stock? Of course, ordinary people such as you and I cannot do this, but large investors and investment firms can, they sell the stock immediately without even borrowing it (let alone buying it), in other words, they are selling something that they don’t have and will never have. This is called naked short selling. Let me explain this more…

Every trade made on the stock market consists of two transactions, a buy and a sell. When you buy a stock, somebody is selling that stock, and when you’re selling a stock, somebody is buying that same stock from you. Of course, you don’t know to whom you are selling and who’s buying from you, and you don’t care. Now, this buy-sell trade keeps the stock price in check, when you are selling and there is no buy at your current price, the stock will drop in value, until the system automatically locates a buyer who is willing to buy your shares for the current stock price (and not the price that you initially sold at). Let’s look at the example below to see the difference between a normal trade and naked short selling trade.

Naked short selling example

Normal sell order: You are trying to sell 10,000 shares of SIRI at the current price of $1.94. The system tries to find a buy who’s willing to pay $1.94, but couldn’t find any, it tries again for someone who’s willing to pay $1.93, but with no luck. Finally, the system will find a buyer who’s willing to pay $1.90. At this point, we have a buy transaction, which will pump the price of the stock a bit, or at least stop it from falling further.

Naked short selling: Now, imagine you are selling 10,000 of shares of SIRI that you don’t even have, no one is interested at $1.94, so the stock drops further. At $1.90, a buyer shows up, and wants to buy the SIRI shares from you, but guess what, you don’t even have the shares (this is called “failure to deliver” – by the way, when you sell stocks you have 3 days to deliver these stocks to the buyer, but in your case you’ll never be able to). So, practically, we have a sell transaction that created supply in the market, but the buy transaction that creates the demand will never happen. So the stock will continue to decline… Now imagine that this scenario is done at a very large scale? What will happen? A huge supply will be created in the market with no possibility for demand to exist (because the supply is fake). Obviously, the stock price will be in free fall. That’s what naked short selling can do!

Naked short selling reduced AIG’s stock price to less than half a dollar ($10 if we take the 1:20 reverse split that took place in 2008) back in 2008. Naked short selling also accelerated the fall of Lehman Brothers.

Naked short selling is considered to be a form of market manipulation, and as such is banned by the SEC (see here for more information). Short selling, on the other hand, is legal and is heavily practiced and is considered to be one of the stabilizing factors in the price of a stock and in the market as general.