I used to take the public transit last year, and sometimes, yo do actually get to overhear some interesting conversations. One of these conversations was between 2 university students, apparently both were taking an investment course, and one of them was discussing his professor’s theory with the other. Here’s the professor theory: “If there are two stocks that are similar (same industry, same markets, etc…), and if one of them is going down while the other is going up, then you should buy the one going down, and sell the one going up, because such stocks should move in harmony (when one goes up, the other goes up as well, and vice versa).” The professor apparently then gave an example about PepsiCo, Inc (NYSE: PEP) and The Coca-Cola Company (NYSE: KO). Let’s take a look at these 2 stocks in the same chart to see if that professor’s theory is correct:
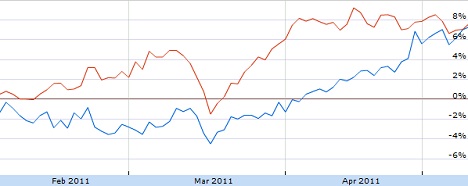
Pepsico vs. Coca Cola (PEP = blue, KO = red) – Courtesy of Google Finance

As you can clearly see, PEP and KO diverged in February, where PEP started to move up while KO started to move down, but in March, PEP dropped significantly, while KO dropped only slightly, and, immediately after this drop, both KO and PEP started to move up, with KO outperforming PEP, until the converged again in April. In this case buying a stock is not rocket science, any informed investor should have bought KO when it started to go down while PEP was moving up.

Now, after I exposed this theory, which appears to apply for PEP and KO, let’ see if it applies for RIG and NE, theoretically, it should, since both RIG and NE are in the same business (they both offers services for offshore drilling, including building platforms). Here’s the comparative performance chart:
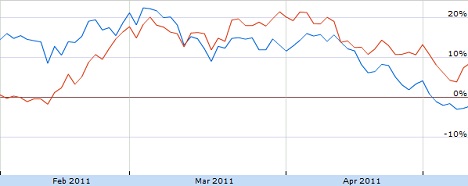
Transocean Limited vs Noble Corporation

It’s obvious to see that the two stocks are moving in harmony. However, you can notice that they have started diverging by mid of April, where RIG has started to drop considerably more since. What does that mean? It means that any investors with even a half a brain should start buying RIG, it’s almost a sure bet that the stock will go up (unless something insane happens in the oil services industry).

To summarize, from the chart above, we can see that RIG is undervalued by at least 10%, and it can easily go up by a 5% in the next week or two, and probably maybe meet NE somewhere in the middle.

As you may already know, Citigroup traded today at 10 times the amount it was trading on Friday. Wait! Did the stock go up a 1000%. Of course not, it there it was just reverse split, where 10 stocks on Friday were grouped into 1 stock this Monday morning. C is now trading at $44.16, after it was trading at $4.51 on Friday.

Now the question, how did the market react to this reverse split? The quick answer is “Not well”.

The stock dropped 2.3% on more than average volume. Quick note here: the volume on Citi is now misleading, it should be multiplied by 10 to be compared to the average volume, and since there was a volume of 49.29 million shares, then the real volume was 492.9 million shares compared to an average volume of 376 million shares. Note to Google: Please fix the volume to reflect the new reverse split. It would also be nice to fix the other stock data, as we no longer know which one is right and which one is wrong. Anyway, going back to C, it seems that investors didn’t really appreciate the reverse split (which is common mainly in penny stocks), despite that C was upgraded to overweight by Morgan Stanley. Generally, stocks tend to drop until they find a decent support in reverse splits, look at AIB, for example (of course, AIB is, sooner or later, going to a penny).

I believe in C, but I think that bank stocks, in general, are currently in a downtrend and are stuck in this bearish hell. Even the best of news can’t get them out of there, unless big investors decide that it’s time to reverse the trend.

Anyways, despite all this, I think C can easily close the year at around $60 (maybe more), and I think it’ll start going up in a couple of months. Time will tell…

After posting yesterday the top 100 most expensive stocks, I have thought that a logical follow-up post would be a list of the top 100 stocks with the lowest P/E. Only the NYSE and the NASDAQ exchanges are analyzed..

Now you may ask, what is the this usefulness of this list? To some investors, it is worthless. To others, I think it might be very interesting. Imagine buying the stock of a company that is trading at a P/E of less than 1 (do such companies exist? Well read the list below!). It will take this company less than a year to pay back all the investors and go private again, it will also make the company a target for an acquisition by a bigger player in the same industry. I don’t know about you but I think this would be a very interesting stock to own and to make money of on the short term!

Anyway, here’s the list:

Rank Symbol Stock Name (Company) Price P/E
1 BRK-B Berkshire Hathaway 80.21 0.01
2 IIJI Internet Initiative Japan Inc. 7.95 0.03
3 JTX Jackson Hewitt Tax Service 0.185 0.39
4 NCT Newcastle Investment Corp. 5.80 0.52
5 GRH GreenHunter Energy, Inc. 0.87 0.99
6 GIGA Giga-tronics, Incorporated 2.6501 1.00
7 ABR Arbor Realty Trust, Inc. 5.12 1.14
8 PT Portugal Telecom 12.06 1.32
9 C Citigroup, Inc. C 4.52 1.45
10 LEE Lee Enterprises 1.10 1.60
11 RAS RAIT Financial Trust 2.20 1.99
12 MAXY Maxygen, Inc. 5.10 2.22
13 TKF Turkish Investment Fund Inc. 17.07 2.41
14 FMFC First M & F Corporation 4.10 2.46
15 REV Revlon, Inc. 16.15 2.52
16 XRTX Xyratex Ltd. 9.83 2.57
17 HIX Western Asset 10.29 2.57
18 IMH Impac Mortgage Holdings 3.35 2.74
19 AIG American International Group 30.70 2.75
20 MAY Malaysia Fund, Inc. 11.18 2.76
21 CIL China Intelligent 2.12 2.77
22 WRLS Telular Corporation 6.70 2.79
23 TRMS Trimeris, Inc. 2.46 2.79
24 GMK Gruma S.A.B. de C.V. 7.56 2.79
25 TTF Thai Fund, Inc. 13.29 2.81
26 MXE Mexico Equity and Income Fund 11.25 2.86
27 ACAS American Capital Ltd. 10.31 2.90
28 APB Asia Pacific Fund 12.4457 2.96
29 ABAT Advanced Battery 1.46 3.02
30 MXF Mexico Fund, Inc. 27.12 3.04
31 TCCO Technical Communications 9.6001 3.05
32 SMTX SMTC Corporation 1.96 3.19
33 THC Tenet Healthcare 6.53 3.22
34 TRIB Trinity Biotech p 9.40 3.28
35 HTD John Hancock Tax 16.24 3.34
36 CH Aberdeen Chile Fu 22.05 3.35
37 SSCC Smurfit-Stone Con 38.02 3.40
38 VALU Value Line, Inc. 13.33 3.52
39 IMOS ChipMOS TECHNOLOGIES 8.39 3.53
40 IIF Morgan Stanley India 22.55 3.61
41 SOL ReneSola Ltd. 8.31 3.62
42 ZOOM Zoom Technologies 3.54 3.67
43 CASH Meta Financial Group 14.00 3.67
44 RIT LMP Real Estate Fund 10.55 3.76
45 CNET ChinaNet Online 3.0198 3.79
46 ENZN Enzon Pharmaceuticals 11.57 3.80
47 PCN PIMCO Corporate Income Fund 17.27 3.81
48 OMN OMNOVA Solutions Inc. 8.68 3.82
49 RQI Cohen & Steers Quality Income 9.91 3.83
50 MFW M & F Worldwide Corp. 23.51 3.86
51 GGT Gabelli Global Multimedia Trust 7.91 3.86
52 SGF Singapore Fund, Inc. 14.35 3.87
53 RVT Royce Value Trust 15.18 3.89
54 RMT Royce Micro-Cap Trust 9.92 3.93
55 TYG Tortoise Energy Infrastructure 38.40 3.97
56 DSU BlackRock Debt Strategies 4.29 4.00
57 FFC Flaherty & Crumrine Preferred 18.10 4.10
58 FLC Flaherty & Crumrine TR 18.82 4.10
59 NAVR Navarre Corporation 1.83 4.13
60 HYV BlackRock Corporate High Yield 12.25 4.16
61 RNP Cohen & Steers REIT/Pfd 15.83 4.16
62 MHI Pioneer Municipal High Income 13.59 4.17
63 DROOY DRDGOLD Limited 5.20 4.17
64 EDS Exceed Company Ltd. 6.81 4.18
65 CHN China Fund, Inc. 31.67 4.19
66 BSD Blackrock Strategic Municipal 12.16 4.21
67 IFN India Fund, Inc. 30.01 4.22
68 MHD BlackRock MuniHoldings 14.7611 4.23
69 PFO Flaherty & Crumrine 10.79 4.25
70 DCS Claymore Dividend 17.20 4.31
71 MBND Multiband Corporation 3.93 4.32
72 HYT BlackRock Corporate High Yield 11.92 4.33
73 PTY PIMCO Corporate Opportunity 20.05 4.33
74 HIS Blackrock High Income 2.25 4.34
75 LPHI Life Partners Holdings 6.82 4.38
76 BTM Brasil Telecom SA 28.20 4.39
77 TRF Templeton Russia 21.78 4.39
78 DCA DCA Total Return 3.93 4.40
79 AVK Advent Claymore 19.21 4.51
80 SSP E.W. Scripps Company 9.25 4.55
81 GAB Gabelli Equity Trust 6.12 4.57
82 SOR Source Capital, Inc. 57.55 4.57
83 BG Bunge Limited 72.62 4.59
84 BBK BlackRock Municipal Bond 14.1599 4.59
85 RBCAA Republic Bancorp 19.70 4.60
86 TICC TICC Capital Corp 10.73 4.60
87 LUK Leucadia National 36.29 4.61
88 HSM Helios Strategic 6.42 4.61
89 MZF Managed Duration 13.52 4.64
90 KTCC Key Tronic Corporation 4.63 4.67
91 BKK Blackrock Municipal 2020 15.0362 4.68
92 BHK BlackRock Core Bond Trust 12.46 4.71
93 CIK Credit Suisse AM 3.76 4.73
94 LAQ Aberdeen Latin America Equity 37.70 4.73
95 BHY BlackRock High Yield Trust 6.84 4.75
96 BTF Boulder Total Return 16.593 4.79
97 XAA American Municipal Income 12.9305 4.84
98 ZNH China Southern Airlines 27.16 4.85
99 TEI Templeton Emerging Markets 17.41 4.86
100 JTP Nuveen Quality 7.79 4.86

The stock with the lowest P/E ever is BRK-B, with a P/E of 0.01, and and an EPS of $7,935.55. Technically, Berkshire Hathaway could buy back this stock with the earnings of 4 days! Not sure what the story of this stock is, or why is it listed in the first place. Note: A kind reader explained the story behind BRK-B. Please read the comments below.

Take a look at C at number 9. According to Yahoo finance, C is trading at 1.45 P/E. According to Google finance, C is trading at 14.57 P/E. I think the inconsistency between the two numbers is because of the 1:10 reverse split that is taking place tomorrow.

A couple of notes on the list above:

– Most of the stocks are fund stocks
– The data for the list above is gathered from Yahoo Finance. Google finance reports some of the stocks above as having higher P/E.

Following my post about the most expensive stock in the world, I have decided to produce a list of the top 100 most expensive stocks. The list only covers stocks listed on the NYSE and the NASDAQ. Without further comments, here is the list (this list is current as of May 6th, 2011):

Rank Symbol Stock Name (Company) Price P/E
1 BRK-A Berkshire Hathaway 120280.00 15.06
2 GOOG Google Inc. 535.30 19.58
3 PCLN priceline.com Inc 519.03 51.59
4 ALX Alexander’s, Inc. 439.33 33.87
5 WPO Washington Post Company 412.25 13.94
6 MKL Markel Corporation 408.12 15.04
7 WTM White Mountains Insurance 353.92 35.50
8 ISRG Intuitive Surgical 348.38 34.91
9 AAPL Apple Inc. 346.66 16.52
10 Y Alleghany Corporation 333.87 15.06
11 CME CME Group Inc. 291.59 19.99
12 AZO AutoZone, Inc. Co 281.56 16.78
13 CEO CNOOC Limited Company 231.82 12.42
14 NFLX Netflix, Inc. 229.47 66.14
15 FCNCA First Citizens Bank 199.08 13.98
16 AMZN Amazon.com, Inc. 197.60 85.37
17 BLK BlackRock, Inc. 195.74 16.99
18 NEU NewMarket Corporation 179.08 13.91
19 MTD Mettler-Toledo Inc. 173.30 25.51
20 IBM International Bus. Machines 168.89 14.08
21 ACL Alcon Inc Common Shares 167.99 N/A
22 ATRI ATRION Corporatio 167.222 16.18
23 HDB HDFC Bank Limited 164.56 28.56
24 PCP Precision Castpar 157.78 22.47
25 GS Goldman Sachs Group 150.10 11.41
26 CRR Carbo Ceramics, Inc. 148.78 43.46
27 GWW W.W. Grainger, Inc. 147.91 18.81
28 WYNN Wynn Resorts, Limited 144.34 58.27
29 CF CF Industries Holdings 137.82 24.20
30 SI Siemens AG America 136.92 20.12
31 MSTR MicroStrategy Inc. 135.29 36.23
32 PTR PetroChina Company 134.89 11.12
33 LZ Lubrizol Corporation 134.14 12.60
34 ESS Essex Property Trust 132.97 117.74
35 CRM Salesforce.com Inc. 132.32 278.66
36 HCH Merrill Lynch Canada 131.45 N/A
37 WLT Walter Energy, Inc. 131.08 15.91
38 RL Polo Ralph Lauren 129.61 21.21
39 WBK Westpac Banking Corporation 127.92 11.39
40 BEN Franklin Resource 126.27 17.81
41 AVB AvalonBay Communities 126.09 82.35
42 SINA Sina Corporation 125.19 N/A
43 APA Apache Corporation 124.21 14.54
44 NVO Novo Nordisk A/S 123.60 24.24
45 FLS Flowserve Corporation 122.55 16.60
46 PNRA Panera Bread Company 119.39 30.91
47 CERN Cerner Corporation 119.14 40.14
48 STRA Strayer Education 118.40 12.47
49 DNEX Dionex Corporation 118.25 34.26
50 TNH Terra Nitrogen Company 118.10 10.08
51 CMI Cummins Inc. 117.24 18.44
52 PSA Public Storage 116.03 45.78
53 SPG Simon Property Gr 114.91 55.01
54 ONEQ Fidelity Nasdaq C 111.254 N/A
55 TIP iShares Barclays 110.94 N/A
56 NPK National Presto Industries 110.65 11.83
57 CAT Caterpillar, Inc. 110.34 26.36
58 BPT BP Prudhoe Bay Royalty 110.17 12.60
59 PKX POSCO Common Stock 109.31 8.72
60 KYO Kyocera Corporation 108.94 12.97
61 EOG EOG Resources, Inc 107.44 165.63
62 BCR C.R. Bard, Inc. C 106.64 19.12
63 FDS FactSet Research 106.43 30.40
64 OXY Occidental Petroleum 106.42 19.05
65 JKH iShares Morningst 105.73 N/A
66 MICC Millicom International 105.70 6.48
67 AMG Affiliated Managers Group 104.72 33.28
68 ESGR Enstar Group Limited 103.90 8.27
69 PII Polaris Industries 103.70 20.64
70 PX Praxair, Inc. Com 103.60 24.99
71 EMN Eastman Chemical 103.46 17.12
72 BXP Boston Properties 103.33 91.39
73 NC NACCO Industries, 103.06 10.67
74 CVX Chevron Corporation 102.88 9.96
75 BAP Credicorp Ltd. 102.54 13.73
76 UNP Union Pacific Corporation 102.34 17.48
77 ACGL Arch Capital Group 101.74 8.14
78 CLH Clean Harbors, Inc. 101.28 20.22
79 VMI Valmont Industries 100.96 25.72
80 FFIV F5 Networks, Inc. 100.90 41.03
81 GNI Great Northern Iron Ore 100.172 8.59
82 EQIX Equinix, Inc. 99.84 96.96
83 VFC V.F. Corporation 99.73 18.15
84 JLL Jones Lang LaSalle 98.69 28.53
85 EL Estee Lauder Company 98.06 31.67
86 CKH SEACOR Holdings Inc. 97.71 8.24
87 LH Laboratory Corporation 97.59 18.28
88 SNP China Petroleum & Chemical 97.06 710.89
89 UHAL Amerco 96.99 12.36
90 WAT Waters Corporation 96.87 22.33
91 JKJ iShares Morningst 96.335 N/A
92 BIIB Biogen Idec Inc. 96.12 21.92
93 ALXN Alexion Pharmaceuticals 95.89 86.12
94 FDX FedEx Corporation 95.65 22.97
95 MMM 3M Company Common 95.60 16.28
96 BHP BHP Billiton Limited 95.50 15.26
97 XEC Cimarex Energy Co. 95.30 14.59
98 OYOG OYO Geospace Corporation 95.18 25.63
99 CSWC Capital Southwest 94.27 6.15
100 SHG Shinhan Financial 94.10 11.42

I have decided to include the P/E of each stock as well because I thought it was a good way to see if a stock is overly priced or not (although we have learned earlier that the P/E, for many investors, is no longer important).

Two stocks that immediately caught my attention are SNP (for mysterious reasons, SNP has a P/E of 7 on Google Finance, but a P/E of over 700 on Yahoo) and CRM. Don’t you think they are a bit too dangerous? I would also say that bot AMZN and NFLX are very risky, both stocks, in my opinion, shouldn’t even be on this list.

I have written before on fear and greed, and how their negative consequences on the stock trader by distorting his judgment and upsetting his disciplined approach to trading.

Fear and greed, are of course, sins in any investor’s vocabulary. Patience, on the other hand, is a virtue. Patience will guarantee that you will make money all the time. Patient investors make money, impatient investors lose money.

You should be patient when buying a stock. When you feel the price is too high, regardless on how others feel about the stock, then maybe it’s too high. When all the fundamentals (low sales, high churn rate, increased competition, reduced forecast) point that a stock should go down while it is going up, then maybe it is not the right time to buy. Trading stocks is like playing a card game where nearly everyone cheats and lies about his cards, and there’s no way to tell, except by trusting your own research and feelings. Once you feel that the stock has reached a point where it’s acceptable to buy when taking the company’s fundamentals, and again, your own hunch, into the equation, then go ahead and buy. Buy 1/3 of your position, and then buy another 1/3 in a week or two, and finally buy the last 1/3 in one month or so.

Now that when you have the stock, when should you sell it? What if the stock goes down more? Let’s first clarify something, if every time every person buys a stock it’ll go up, then there will absolutely no one in this world (and I really mean it) who will do some real work. There is a chance that the stock will go down, and substantially down. Your stocks may lose 20% of their value in a week, or sometimes a day. But you’ve made your own research, you relied on your feelings to make the decision to buy the stock, your feelings never betrayed you. You can, of course, panic and sell, and this is how you will start fearing the stock market and leave it or good. Or you can wait for the stock to go up again, and it will go up, regardless of what others are saying. I remember nearly a year ago people were saying that APPL is doomed because of the antennagate and other problems, at that time the stock was trading at $240. The stock is trading at $348 today. It is not really rocket science to analyze Apple yourself and know that this company will never, ever experience financial turbulences, at least not in the next 5 years. Now the question is, is AAPL a good buy at $348. Maybe it is, it has a low P/E, and they’re still selling iphones and ipads like hot cupcakes, and they no longer have production issues so supply is able to meet demand. Would I buy at $348? My problem with Apple is that it’s a company embodied by one person, Steve Jobs (what if he leaves, or even worse…). But, some analysts say that the company will still do well without him. I think only time will tell.

Going back to you selling the stocks that you bought, well, you have to wait until the stock goes up, and anything in life has its ups and downs. No stock can go down forever, and no stock can go up forever.

Patience, my friend, is a virtue.

…is the stock of the company with the ugliest website. Berkshire Hathaway Inc. (NYSE:BRK.A) is currently trading at $121,650.00 (yes, that’s only only one hundred and and twenty one thousand and six hundred and fifty dollars and 0 cents), which makes it, as the title states, the world’s most expensive stock listed on any market in the world!

Here are some facts about this stock:

– It was listed on the NYSE on June1st, 1990, and it started trading at $7,200 (the stock has rise 16 times since).
– The stock is issued by Berkshire Hathaway Incorporated, the company that is the fruit of Warren Buffet’s labor throughout the years, who’s been known to have made his money through safe, fair, and square techniques. If you don’t believe this, read his letter to the investors in 2010. Focus on the parts on how he met everyone who has worked with him towards building the company, read the last page about the $1,000 that should be put in a safe place, examine the part of how conservative he is with his investments, and how everyone working for him (at the executive level) works in the company as if it was for him. Honestly, I didn’t know much about Warren until I read this letter, which really explains everything, and makes anyone, regardless of his background, respect this man. The man reminds me of Scrooge Mc. Duck, he earned his money the right way, because he worked hard, because he loved money, because he respected money, and he ensured that that love and respect for money do not transform into hatred and greed. The man is also very conservative in his spending habits (by the way, and so are most of the other super billionaires).
– The stock is trading at a P/E of 15.33 and an EPS of $7,935.55. Yes, the company is making that much money!
– It is very hard to acquire the stock, few sell, and it’s really expensive.
– The volume on the stock averages around 500 shares a day, with a few shares being sold or bought every 5 minutes.
– The stock can make or lose ridiculous amounts every day (today for example, the stock has lost $660 so far – actually make that $1,285.00. In the 10 minutes from where I started writing the article the stock has lost another $600).

It’s a huge privilege to own this stock, not only because it’s very expensive, but because of the company behind it, and because of the man behind this company.

Now going back to the Berkshire Hathaway’s website, although I believe it is one of the ugliest websites in the world, I felt at ease when I visited it. I knew exactly what I wanted and I got it instantly, I didn’t have to search (well there’s no search functionality anyway), everything that I needed was just on the front page. With the exception of Google, I couldn’t think of a simpler website that offers the visitor exactly what he wants.

Oh, and by the way, read the Geico story in Warren’s 2010 letter to the investors. Actually, read everything in the letter, if a man so important has written such a letter, then the least thing we can do is read it all, and maybe learn from it a thing or two (optimism, how opportunities present themselves if you persist, etc…)

I always believed in C (Citigroup Inc.). It is one of those rare stocks that I believe will rebound extraordinarily when they do rebound, and I always made money on this stock, regardless of the price at which I bought it.

Let’s examine the performance of C for the last several months (image courtesy of Google finance):

Citigroup Chart - 6 Months

Citigroup Chart – 6 Months

Similarly to BAC, C had a good January Effect. The stock reached a high of $5.13 and then dropping 23 cents the next day, and this is where the bearish movement on the stock started.

The stock has since (the peak) dropped 12%, and it seems that it can’t get out of the bearish hell. It seems that investors lost their appetite for C. The stock will even be less attractive in a few days, when the reverse split of 1:10 will take place (reverse splits always signal that the stock will go down in price). At the current price, the stock will be around $45 after the reverse split, which will heavily reduce the volume, and will probably kick out the small investors who buy a few thousand shares and then sell them in a few days.

I think on the short term, C will suffer a bit, but will still probably close the year at around $60 (of course, after the reverse split).

One of the factors that I use to buy stocks is their P/E Ratio (Price/Earnings Ratio). The P/E Ratio is calculated by dividing the share price by the EPS (Earnings Per Share). For example, in the case of RIG, the P/E Ratio = Share Price/EPS = 73.10/2.97 = 24.61. This tells us that it will take Transocean LTD 24.61 years (at the current EPS) to buy back its public debt. So, the lower the P/E ratio is, the better.

But what is the maximum acceptable P/E ratio to consider a stock?

In my opinion, a stock that is trading about a P/E of 30 should be avoided as it is considered to be overvalued. Here’s a breakdown of the P/E Ratio, as well as the stock attractiveness:

P/E is between 0 and 5: Technically, the stock is very attractive when it has this P/E. But one has to think why is it trading that low, when it’s that attractive. Obviously there’s more to the story, so it’s better to research the stock, maybe the company (or one of its products) is under investigation/probe, is constantly changing its forecasts, or their main product is soon to become obsolete. The public company with the lowest P/E is Newcastle Investment Corp.. This company is able to buy back all its shares in almost 6 months!

P/E is between 5 and 10: A very attractive stock, but also needs to be researched as there’s also probably more to the story.

P/E is between 10 and 20: This is where most of the delicious and blue chip stocks are located, including AAPL, GOOG, C, and the rest. I find that stocks located in this range are the least risky, and can provide the investor with decent profits.

P/E is between 20 and 30: The stock is now less attractive, but should still be considered if it’s a solid company

P/E higher than 30: I avoid all stocks with a P/E higher than 30, although many investors don’t (again, look at NFLX). In my opinion these are risky stocks, and any negative change in the market climate for the relevant industry of the company can have catastrophic events.

Now my question was, Is the P/E Ratio Relevant? Personally for me, it is, but, apparently for many other investors, it’s meaningless. Most investors, while buying or selling shares of a company, try to see into the future of the company, what are its forecasts? Will there be any change in management? Will the products offered by the company face competition? Will the products become obsolete in the near (or the medium) future?

There are many examples of very decent stocks demonstrating that investors care more about the future of the company rather than it’s current P/E. Examples of these stocks include:

AIG: The insurance giant has a P/E of 2.19, but investors have been burned so many times with this stock (AIG used to trade above the $1400 4 years ago). Investors also have questions about the future of AIG, and whether or not they still have some hidden (dark) secrets.

RIMM: The Canadian blackberry creator is trading at a P/E of 7.6, but Research In Motion is consistently releasing estimates that are lower than the analysts forecasts. Not to mention, of course, that investors are skeptical of its products. I’ve said it before, RIM is no longer innovative, and, so when it regains the innovation momentum, and it demonstrates some humility, then expect the stock to drop considerably more.

Conclusion

Obviously, the P/E ratio is of very little relevancy when buying or selling stocks. Investors care most about the future of the company (on the long term), and about rumors surrounding the company (on the short term).

I’ve traded with most bank stocks and I can safely list the 3 worst bank stocks currently listed on the market (starting from the ultimate worst, oddly enough the list below is also sorted by alphabetical order):

AIB (Allied Irish Bank)
BAC (Bank of America Corporation)
IRE (Bank of Ireland)

Let’s start with AIB, which is by far the worst bank stock, although the stock has miraculously gained 45% in the last month, I still consider it the trash of bank stocks. AIB has lost around 81% of its market value in the past 12 months (including the current month), and is one of the most volatile stocks ever. I still believe that the stock price is heading for a penny, even though it gained in the last month and there was reverse split (1:5) back in February. Unless you’re a huge gambler, don’t play with this stock.

BAC is a stock that I lost a lot of money with. I hate this stock. Everytime it reaches $15 the stock starts selling like hot cupcakes, and then, of course, it loses anything between $1 to $5. Bank of America has a lot of issues, and many investors have been burned badly with this stock, many times already, so, whenever there’s a bearish movement on the stock, investors start to flee en masse. The stock had a nice January effect though.

IRE is a stock that I have never traded, but one that I closely monitored because I find it moves somewhat proportionally to the worst bank stock of all time, AIB. IRE has lost around 77% of its value in the past 12 months, but has gained around 14% in the last month. Still this stock is bad.

So will these stocks get worse? Well, I’m one of those believers that the peak of financial stocks is reached in April, so in my opinion, it’ll probably be downhill to all of these stocks from here.

As for the best bank stock, well, it’s obvious, it’s Citigroup. I have a hunch that this stock will reach $6 by the end of the year (which is about $60 after the reverse split of 1:10 which is planned in just over a week from now).

April 30, 2011 | In: Financial

Is AIG Undervalued?

I check AIG, probably one of the scariest stocks ever, from time to time, so that I know if I had bought AIG when the stock was trading at $0.5 back in 2009 (well the stock had 1:20 reverse split since, so it was effectively trading at $10). Yes, that’s the greed (and remorse) in me playing his dirty little game. Sometimes I can’t help it, I’m still a human.

AIG has closed Friday’s trading session at $31.15, which was the lowest close in a year. It a yearly low of $31.11. The stock is now trading at half the price it was trading back in January 2011 (that’s 3 months ago). Of course, one could argue that the January effect had a huge impact on AIG, but I think there was also a lot of bullish speculation back then. Unfortunately, there is a lot of bearish speculation right now. Take a look at the stock’s technicals. The stock is very bearish on the short run and the medium run. The stock is neutral at the long run.

Now take a look at the stock’s trend, since the beginning of the year:

AIG – 6 months trend

You can easily see the artificial bubble between December and January (typical pump and dump).

Technically, there is no argument that there are huge signals to avoid buying the stock. But what about the fundamentals of the stock. The stock is currently trading at a P/E of 2.21. Which means, that it’ll take the company roughly 27 months to buy back all the shares at the current stock price. Doesn’t this make the stock an attractive buy? What if AIG really decide to do that? Additionally, all the data is signaling that AIG is recovering, and in a big way. Quarter 4 of 2010 was 3 times better than the whole year of 2010.

I think stock investors are very harsh on AIG at the moment, and why shouldn’t they, this stock has wreaked havoc on the stock market, and is currently trading at 2% of its 2007 peak. But looking at the fundamentals of the stock, I think it’s a buy for a long term, but I wouldn’t enter until the stock finds a decent support level, and breaks the bearish trend.