May 22, 2011 | In: Technology

Will RIM Go Bankrupt?

Before discussing the topic of this post, let’s first examine RIMM for the last 6 months:

RIMM for the last 6 months

As you can see from the above, RIMM is stuck in a bearish hell since the beginning of March, after recovering from a near imminent death back in September. With a P/E of only 6.85 and an excellent worldwide reputation, one has to wonder, why are investors very harsh with this stock?

The answer lies I think with Research in Motion’s vision, it hasn’t changed at all since they invented BlackBerry, their flagship product. While change is not good when it comes to (good) ethics (if you’re a good person you shouldn’t embrace change and become a bad one), not embracing change can easily kill a technology company (remember Nortel and Palm)?

But how did RIM not embrace change? Well, for starters, in a world where everything is heading to open source and all companies are opening up to each other, RIM is sticking to Microsoft’s approach: “Closed technology, and no open source”. RIM is also still spending a lot of money on its hardware division that has been producing nothing but flops recently. The problem is that RIM is trying too hard to imitate Apple that it’s forgetting to focus on its real cash cow, which is the BlackBerry Service. But how about BBM’s future?

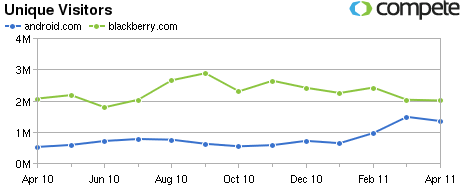
The problem with BBM is that it’s only available on the BlackBerry phones, and seeing that interest in Android has almost caught up with Blackberry’s (see the image below), that is not a good strategy at all.

Android vs. BlackBerry (Android is in Blue, BlackBerry is in Green)

RIM insists on only providing the BBM service on its exclusive phones, but when everyone stops using their ugly and outdated phones, who will RIM be able to sell the service too? Imagine if RIM strikes a deal with Google and/or with Apple and/or mobile providers to provide the BBM service on Android phones, iPhones, and Symbian based phones (Nokia phones). Apple’s market alone is 15 times that of RIM, is anyone at RIM aware of the huge potential this “opening up to others” represent for the company? Not only RIM would get out of this mess victorious, but will get out stronger than it ever was, maybe 20 times stronger! Imagine the BBM service available on every phone in every country all over the world, the BBM service will be the 21st century equivalent of the SMS (Short Messaging Service). For $15/month, anyone, anywhere, with any phone can communicate via text with anyone else in the world. It’s amazing, yet RIM’s management appears to be oblivious to this.

Is it too late?

Let’s assume that Mike Lazaridis (RIM’s CEO) wakes up tomorrow morning and reads my article, and thinks, wow, that’s a great idea! I will open up the BBM platform to every phone in the world, and I will start making more money than ever. But, if he does this tomorrow morning (instead of doing it 2 years ago), will it be too late? If it’s tomorrow then I think there’s still a chance to save the company, but if it’s in a year from now then RIM, at this point, will be past redemption. Apple, Google, as well as a myriad of other 3rd party companies are working day and night to provide a similar service. The question is, how much time will it take one of these companies to come up with a similar solution that is phone-independent? As someone with a programming and a telecommunication background, I can answer with confidence that RIM doesn’t have a lot of time before a similar service is launched, and when this similar service is launched, then expect RIM’s stock to be trading in single digits (e.g. below $10, yes, that’s how bad it will get).

RIM should get its act together, immediately, and my advice for the investors is to jump ship, until RIM’s executives wake up from their euphoria, and if they don’t, then it’s a certainty that RIM will go bankrupt in a couple of years, because it will simply become disconnected in an increasingly connected world.
I like the “Top 100” lists that I’m creating. This time I have decided to create a list with the top 100 stocks, with high volume, that are trading below their book value. Let’s take a look at this list…

Rank Symbol Volume Book Value Price Price as a % of Book Value
1 BAC 135154000 21.153 11.58 54.74%
2 C 42391900 58.455 41.02 70.17%
3 JPM 29228700 43.357 43.13 99.48%
4 BSX 20156200 7.439 6.80 91.41%
5 KEY 15441100 9.575 8.40 87.73%
6 CX 13965200 15.689 8.27 52.71%
7 FITB 13755400 12.806 12.72 99.33%
8 RF 12974600 10.533 6.95 65.98%
9 VLO 11900700 26.709 26.05 97.53%
10 MET 11362500 47.17 44.22 93.75%
11 SNV 9354970 2.474 2.37 95.80%
12 BPOP 8946580 3.669 2.92 79.59%
13 STD 6531200 11.857 11.10 93.62%
14 TLAB 6128110 5.123 4.65 90.77%
15 HCBK 6072640 9.576 9.20 96.07%
16 STI 6034590 37.865 27.89 73.66%
17 GNW 5250660 28.67 11.12 38.79%
18 HIG 5090720 45.928 27.09 58.98%
19 WEN 4979880 5.172 4.98 96.29%
20 AIG 4837860 47.323 30.80 65.08%
21 MI 4806610 11.727 7.98 68.05%
22 PBCT 4684750 14.915 13.41 89.91%
23 PMI 4551910 1.782 1.39 78.00%
24 DPTR 4488710 1.709 0.705 41.25%
25 NBG 4322060 2.671 1.33 49.79%
26 ALL 4315090 36.855 32.01 86.85%
27 ETFC 4312790 19.096 15.60 81.69%
28 MTG 4247040 7.996 7.45 93.17%
29 COF 4070180 60.523 55.07 90.99%
30 RDN 3997370 7.309 4.39 60.06%
31 XL 3987480 29.956 23.54 78.58%
32 IRE 3943830 7.924 1.78 22.46%
33 ACAS 3772740 11.969 9.82 82.05%
34 CSE 3656380 6.406 6.37 99.44%
35 PRU 3511770 67.055 63.61 94.86%
36 RAS 3489230 8.448 2.03 24.03%
37 LYG 3480420 4.244 3.33 78.46%
38 MBI 3471850 8.806 8.71 98.91%
39 UMC 3445700 3.05 2.60 85.25%
40 ZION 3085210 24.93 23.31 93.50%
41 LNC 3052800 41.76 29.21 69.95%
42 NRG 2897480 30.734 25.27 82.22%
43 DYN 2786490 21.94 5.95 27.12%
44 FBC 2778750 1.782 1.34 75.20%
45 NDAQ 2731550 28.508 25.50 89.45%
46 GMR 2717610 3.512 1.86 52.96%
47 CEG 2657130 39.647 37.39 94.31%
48 COCO 2639550 6.632 4.10 61.82%
49 ABAT 2563360 2.685 1.53 56.98%
50 AUO 2524400 9.96 7.62 76.51%
51 LPX 2469990 9.076 8.09 89.14%
52 MF 2393440 8.343 7.45 89.30%
53 CNO 2373170 17.503 7.60 43.42%
54 AGO 2307540 21.142 16.61 78.56%
55 USU 2272580 10.936 4.01 36.67%
56 BYD 2233430 13.831 9.45 68.32%
57 BZ 2203710 8.238 8.11 98.45%
58 PFG 2195080 31.707 31.58 99.60%
59 ACE 2177420 69.329 68.61 98.96%
60 UNM 2171940 29.077 26.72 91.89%
61 BCS 2171030 27.692 17.78 64.21%
62 ING 2132220 17.054 11.70 68.61%
63 BZH 2013610 4.002 3.74 93.45%
64 CEDC 1961980 23.826 11.78 49.44%
65 AEE 1952180 32.041 30.02 93.69%
66 CIT 1829810 44.845 41.96 93.57%
67 TNE 1766730 17.872 16.89 94.51%
68 ACLS 1721200 1.98 1.77 89.39%
69 FBR 1676880 20.876 14.73 70.56%
70 AIB 1604910 4.24 2.80 66.04%
71 LM 1601240 37.889 33.55 88.55%
72 ORI 1579030 15.897 12.80 80.52%
73 TKLC 1559690 8.662 8.45 97.55%
74 GLBL 1554230 6.434 6.14 95.43%
75 OCR 1546820 32.883 31.84 96.83%
76 FNF 1490210 15.556 15.54 99.90%
77 JNY 1436500 13.265 12.62 95.14%
78 SFI 1416970 18.673 8.43 45.15%
79 BDN 1401760 13.607 12.06 88.63%
80 IM 1399570 21.097 19.00 90.06%
81 CSR 1396310 8.101 5.15 63.57%
82 L 1319210 45.54 41.74 91.66%
83 CFFN 1296370 12.196 11.83 97.00%
84 CSC 1236770 46.342 44.58 96.20%
85 XING 1227890 5.576 1.84 33.00%
86 AEG 1207500 17.005 6.82 40.11%
87 FR 1171860 12.026 11.77 97.87%
88 SNE 1163390 35.624 27.05 75.93%
89 ASBC 1126220 15.463 14.33 92.67%
90 KT 1119850 21.965 20.03 91.19%
91 AXS 1108350 41.172 33.35 81.00%
92 DRL 1083520 3.996 1.74 43.54%
93 UCBI 1077760 2.968 2.17 73.11%
94 HMC 1064270 60.316 37.29 61.82%
95 DB 1037770 77.31 58.43 75.58%
96 REVU 1029190 0.333 0.1801 54.08%
97 TM 1029050 80.676 79.96 99.11%
98 BG 1016540 81.749 73.83 90.31%
99 AIZ 1001320 48.477 37.95 78.28%
100 GXP 978776 21.135 20.97 99.22%

By looking at the above, we can see that the top 3 high volume stocks trading lower than their book value are BAC, C, and JPM – all of them are bank stocks. Hmmm…. Does that mean that bank stocks are currently undervalued? I believe so, but that bearish trend that started with the recession back in 2008 is really hard to break.

Notes

  • The “volume” represents the average daily volume.
  • The higher the percentage of the book value is, the less attractive is the stock (from the “book value perspective”).

I have written about the LinkedIn IPO before, and I estimated that LinkedIn is worth anything between $1 billion and $10 billion. I also said that a range of $3 to $5 billion is more likely. I estimated the price of LinkedIn based on Facebook’s valuation of $50 billion: I compared the traffic between the two, and took into consideration that LinkedIn’s traffic is of higher quality than that of Facebook.

Yesterday, LNKD became public, and it is currently trading at $102, and with a 94.50 million shares, this gives it a total market capitalization of $9.64 billion. The stock reached a high of $122 yesterday for a total market capitalization of $11.52 billion!

Obviously, we haven’t heard the end of this, and I think that the stock has the potential to go up another 50% by the end of next month, which makes the value of LinkedIn around $15 billion. And, if the bullish sentiment remains, LinkedIn will be worth $20 billion by the end of the year, where the stock price will probably be around $211.

I took a finance class last fall, and I remember the teacher telling us that the reason behind any IPO is to expand the business with cheap money (money with no interest rate or serious commitment). Now if I look at the LinkedIn IPO, I don’t see it at all a way to expand the business, the business is online, how big can it get? I only see it as a scam to fill the executives’ pockets (who own many shares at peanut price) with billions of investors’ money, but hey, that’s just me, maybe I’m too skeptical.

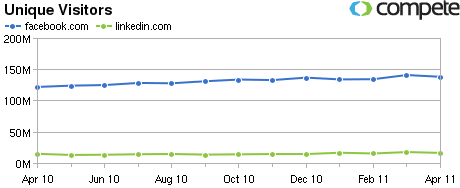
Regardless of what I believe, the market decided that LinkedIn is now worth $10 billion on the second day of trading. Now, if LinkedIn is worth $10 billion, then the market is saying that Facebook is really worth $50 billion! That’s right, when I wrote the article on the LinkedIn IPO a few months ago, I reached a valuation of LinkedIn at $10 billion by starting with a valuation of Facebook at $50 billion. But, in my calculation, I assumed that Facebook’s traffic is 50% less important than LinkedIn’s traffic, but if the market decides that both LinkedIn’s and the Facebook’s traffic are equivalent, then, based on the chart below, we can say that Facebook is worth 8.5 times what LinkedIn is worth, in other words, $85 billion!

Facebook’s Traffic vs LinkedIns’ Traffic: Facebook has 8.5 times the traffic of LinkedIn

Regardless of what I think or what any other investor would think, I am sure that $85 billion is how much the market will decide Facebook is worth in the first couple of weeks. I think if the momentum is kept, then Facebook can easily be valued at $150 billion in a year after its IPO. After all, it’s second only to Google, which is valued at $170 billion, and Facebook has the advantage of offering its users with much more targeted ads than Google (which tries to guess who the user is and what his interests are through search queries, versus Facebook that knows who the user really is, and what his interests are).

Keep in mind though that, unlike Google, both Facebook and LinkedIn are websites that can be easily cloned. I don’t know if investors are taking that into consideration (see investing in social networks). Pump and dump is the key here, but the question is, when is it the right time to dump?

May 19, 2011 | In: General

Is It CDN or CAD?

I think most of the investors, with the exception of forex traders, aren’t sure of the right abbreviation of the Canadian dollar (the loonie). Is it CDN or CAD?

In order to answer this question, I used Google! I entered, in the Google search box, the following: “2500 CDN in USD”. Google, in my opinion, should be intelligent enough to correct this, let’s see the results!

CDN corrected to CAD by Google

As you can see from the above, Google corrected CDN to CAD, which means that most people use CAD instead of CDN. But is CAD the official acronym of the Canadian dollar?

Let’s check with the bank of Canada… Take a look at the Bank of Canada’s Exchange Page. On the right sidebar, you will see the latest USD-CAD rates. As you can clearly see, the Bank of Canada, the official issuer of the Canadian currency, referred to it as CAD. I think that settles the issue! The correct acronym is CAD!

Note that some people also use CAN to refer to the Canadian dollar, which is also wrong.

An active trader is simply a stock trader who makes many trades in a relatively short time and consequently benefits from a special (cheaper) pricing on the commission rate when trading equities and options. An active trader also has some other benefits, such as access to Level II quotes, and (more) real time data.

Here’s a comparison of Active Trader programs between the different Canadian Banks.

Bank of Montreal (BMO)

Non-Active Trader Pricing

  • Equities: $29/trade + $0.03/share for over 1,000 shares
  • Options: $29/trade + variable commission based on the option price (ranging from $1.5 to $3.5)

Active Trader Eligibility Criteria

BMO has only one active trader program, the eligibility criteria is that you must have made at least 30 traders within the last quarter OR have $50,000 in assets with BMO.

Active Trader Pricing

  • Equities: $9.95/trade flat
  • Options: $9.95/trade + $1.25/contract

Canadian Imperial Bank of Commerce (CIBC)

Non-Active Trader Pricing

  • Equities: $28.95/trade + $0.03/share for over 1,000 shares
  • Options: $28/trade + variable commission based on the option price (ranging from $1.2 to $2.80)

Active Trader Eligibility Criteria

CIBC has 2 Active Trader Programs:

  • Program 1 Eligibility Criteria: At least 150 trades every quarter.
  • Program 2 Eligibility Criteria: At least 30 trades every quarter OR at least $50,000 of household assets registered with CIBC.

Active Trader Pricing

Program 1

  • Equities: $6.95/trade flat
  • Options: $6.95/trade + $1.25/contract

Program 2

  • Equities: $9.95/trade flat
  • Options: $9.95/trade + $1.25/contract

Royal Bank of Canada

Non-Active Trader Pricing

  • Equities: $28.95/trade + $0.03/share for over 1,000 shares
  • Options: ($35/trade + an average of 0.03/share) x 20% (yes – it’s a complicated formula)

Active Trader Eligibility Criteria

RBC has 2 Active Trader Programs:

  • Program 1 Eligibility Criteria: At least 150 trades every quarter.
  • Program 2 Eligibility Criteria: At least 30 trades every quarter OR at least $50,000 of household assets registered with RBC.

Active Trader Pricing

Program 1

  • Equities: $6.95/trade flat
  • Options: $6.95/trade + $1.25/contract

Program 2

  • Equities: $9.95/trade flat
  • Options: $9.95/trade + $1.25/contract

Scotia Bank

Non-Active Trader Pricing

  • Equities: $28.95/trade + $0.03/share for over 1,000 shares
  • Options: $25.95 + variable commission based on the option price (ranging from $0.80 to $2.80)

Active Trader Eligibility Criteria

Scotia Bank has 2 Active Trader Programs:

  • Program 1 Eligibility Criteria: At least 90 trades every quarter.
  • Program 2 Eligibility Criteria: At least 30 trades every quarter.

Active Trader Pricing

Program 1

  • Equities: $8.95/trade flat
  • Options: $8.95/trade + $1.25/contract

Program 2

  • Equities: $14.95/trade flat
  • Options: $14.95/trade + $1.25/contract

TD Canada Trust

Non-Active Trader Pricing

  • Equities: $29/trade + $0.03/share for over 1,000 shares
  • Options: $29/trade + $1.75/contract

Active Trader Eligibility Criteria

TD Canada Trust has 2 Active Trader Programs:

  • Program 1 Eligibility Criteria: At least 150 trades every quarter.
  • Program 2 Eligibility Criteria: At least 30 trades every quarter OR at least $50,000 of household assets registered with TD.

Active Trader Pricing

Program 1

  • Equities: $7/trade flat (there is no limit on the number of shares one can buy)
  • Options: $7/trade + $1.25/contract

Program 2

  • Equities: $9.99/trade flat
  • Options: $9.99/trade + $1.25/contract

What Is the Canadian Bank with the Best Active Trader Program?

By looking at the numbers above, we can easily say that both RBC and CIBC have the best pricing, but that doesn’t make them the best banks to trade stocks with. I personally despise both banks (RBC from personal experience, CIBC because of some of my friends’ horror stories). I personally trade with BMO, but I think both TD and Scotia are also worth looking at. I don’t think I came up with a decent conclusion, I literally stated that all 5 banks are worth trading with, which is not saying much, and no, you can’t have the 30 seconds or so you spent reading this section back.

Notes

  • For equities/options traded in CAD, the currency in the above is in CAD. For equities/options traded in USD, the currency in the above is USD.
  • The prices above reflect the Internet pricing only (e.g. trades that you make by using your PC). Phone pricing (trades made by calling the bank) is higher.

References

May 17, 2011 | In: General

When Is a Stock Delisted?

I have never traded AIB, but for some reason, I feel that this stock should not be listed. So I started wondering, how does a stock get delisted from the stock exchange?

Apparently, the delisting rules and procedures are different between the NYSE and the NASDAQ, but they both share one common rule: A stock should never have a bid value below $1 for a period of more than 30 trading days. Failing that, the company is officially that it will risk being delisted if it doesn’t get the stock price over $1 within 6 months after receiving the notification. Note that in some cases, if the NYSE or the NASDAQ notice that short-selling is blocking the stock price to go over $1, then they can block short selling for that particular stock.

There are many (and I mean many) other rules that the company has to conform to to maintain presence in the stock exchange, for example, in case of the NYSE, the company must have at least 400 shareholders or 600,000 publicly held shares (of course, there are many other rules that the company has to abide to in order to maintain its listing). As for the NASDAQ, the company must have at least 300 shareholders and at least 500,000 publicly held shares (again, there are other applicable rules).

Going back to AIB, I believe there will be a reverse split (5:1) in the near future. I guess sooner or later, and if they keep doing these reverse splits, the stock will not even have 5 shares to be reverse split. The stock has fallen nearly 18% so far this month. Watch how the stock will fall another 18% till the end of the month. Oh, and the short ratio is 0.3 (not high at all, so never expect a short squeeze).

References

NYSE Listing Rules
NASDAQ Listing Rules

May 16, 2011 | In: Technology

Will CSCO Ever Recover?

I have traded CSCO late last year, I remember I bought it right after the big drop back in November, and I sold it in January for a small profit. It wasn’t the best trade, and I wanted to hold the stock more, but of course, the stock collapsed yet another time in February.

CSCO 6 months trend

You can see from the chart above the very bearish movement of the stock. To see what big traders think about CSCO, let’s examine its short ratio:

Shares short: 48,500,000 down around 7 million from the previous month (March 2011)
Total shares: 5,530,000,000
Short Ratio: 0.6
Short Percentage of float: 0.9

You can clearly see that the short ratio is healthy, but the problem with Cisco is that they keep reporting results and forecasts below analysts expectations. But, on the other hand, the stock is trading at an attractive P/E of 13.04, and it’s currently only double the price of its book value. Again, CSCO is a stock that is making money, CSCO products are in high and increasing demand. Wait till the economy really picks up and you’ll see where this stock will be. Cisco is not a bugs bunny company, and nor its a bank, and definitely this bearish trend will be broken sooner or later.

On the other hand, I do think that there’s a potential that the stock will drop considerably further though, by considerably, I mean to the $10 level, and at this price, it’ll be extremely attractive even for a short term investment.

One last thing, CSCO’s current MACD is very bullish. Let’s see!

Since it’s Saturday, I figured I publish something light and, of course, interesting to the investors. Today I will focus on the oldest listed stocks in the NYSE and the NASDAQ.

So, what is the oldest listed stock on the NYSE?

The oldest listed stock is that of “Bank of New York” (see here), now listed under the “The Bank of New York Mellon Corporation”, stock ticker is BK. The stock has dropped 7% so far this year, and is currently bearish on the short, intermediate, and long term. It has an EPS of 2.13, and its P/E of 13.17 is very acceptable. I would wait though for the stock to reverse the current bearish trend before entering.

Honestly I was surprised to see that the oldest listed stock on the NYSE is still traded! Just think about it, this stock witnessed all the phases of the evolution of the trading platform, that started somewhere with using carrier pigeons to finally using the Internet.

Before discussing the above topic, I think it is important to distinguish between a fiat currency and a commodity currency.

Fiat Currency

Let’s first explain what the word “fiat” means (and no, it’s not an Italian car and it is not an acronym for “Fix It Again Tomorrow”). Fiat is a Latin word meaning “be done“. Now that we explained the literal meaning of the word, let’s examine what a fiat currency is. A fiat currency is money which value is guaranteed by the issuing government. Every currency in the world is a Fiat currency, because if it’s not backed by the issuing government, then it completely loses its value.

Commodity Currency

A commodity currency is a currency which value goes up and down with respect to the USD or a basket of other currencies proportionally with the price of the commodities that are produced and exported by the issuing country (for example, oil, cocoa, natural gas, wheat, corn, etc…). According to the IMF, the relationship between the commodity price and the commodity currency is 10 to 3.8, so a 10% increase in the commodity price will result in 3.8% increase in the currency price. Let’s say, for example, that we have a country producing and exporting both oil and gold (Hmmm, I wonder if I’m talking about Canada), and the price of both combined went up 5%, this means that its currency should go up 1.9% (according to the above ration of 10:3.8) with respect to the USD (which is the purest of the purest fiat currencies).

Now that we explained what both types of currencies are, let’s answer the question. Is the loonie a fiat or a commodity currency? Well, according to the explanation above of a fiat currency, any currency in the world, including the Canadian dollar, is a fiat currency. Imagine that the Canadian dollar decided at one point to stop issuing and accepting Canadian dollars and use the USD instead, what will happen to its value? Who will accept the Canadian dollar for any payment if this happens? No one for sure.

So we’ve established that the Canadian dollar is a fiat currency, but can it also be a commodity currency. According to the IMF, countries with commodity currencies are:

  • Central African Republic
  • Australia
  • Bangladesh
  • Bolivia
  • Ivory Coast
  • Ecuador
  • Ghana
  • Iceland
  • Indonesia
  • Kenya
  • Malawi
  • Mali
  • Mauritania
  • Morocco
  • Niger
  • Papua New Guinea
  • Paraguay
  • Syrian Arab Republic
  • Togo

We can easily notice 2 things by taking a glimpse at the above list:

– Canada is not one of them
– Most of these countries have very weak and poor economies

The thing is, when defining the commodity currency above, I have explicitly omitted that for a currency to quality as a commodity currency, the issuing country’s economy must be heavily dependent on the exports of its main commodities.

In the case of Canada, here’s how each sector’s contribution to the economy is broken down (according to the CIA factbook – 2010 estimates):

  • Agriculture: 2%
  • Industry: 20%
  • services: 78%

The thing is that, in the real world, the oil’s and gold’s exports contribution to the Canadian economy are minimal. Which essentially makes the Canadian currency an non-commodity currency. But, why is it that the loonie proportionally moves with the price of oil and gold? I guess there’s only one answer to this question, “Ask the speculators”.

After writing this article, I have come to realize that the loonie is highly overpriced because it’s heavily relying on the price of the main commodities (which contribution to the country’s economy is minimal), while giving little consideration to the factor that has the biggest impact on the Canadian economy, the US economy!

I believe that when all the dust settles (oil, gold, US economy, etc…), the loonie will regain its real value, which is much lower than what it really is. Not to mention, of course, that a lower loonie provides a huge advantage to the Canadian economy, which exports and services are becoming more and more unaffordable.

Stock investors are often regarded as self-centered, ego maniacs, couldn’t care less about the world individuals. While some of them are like this, most are not. All the stock investors I know are humble, funny, and confident people. Stock investors are smart, they jump at opportunities (after doing a due diligence on a stock), they believe that losing is part of the game, and most importantly they love what they do. They find that their work is fun, and, regardless what everyone says, they don’t think that they hurt anyone in the process.

Again, the stock investors I’m talking about do not represent everyone, but they do represent the good stock investors. So what are the top qualities of a good stock investor?

In my opinion, every successful stock investor possesses the following qualities:

  • He is patient: A successful stock investor doesn’t sell stocks when they go down, and doesn’t buy stocks when they go up. Instead, he waits for the right and calculated opportunity, and then he jumps in. If one of his stocks go down, he waits until it goes up to sell it. The question is, how can this investor not sell at a loss when everyone else is selling… This is because (read the point below)…

  • He has faith: A successful stock investor has faith in his decisions, when he buys, when he sells, and when he holds a stock. That’s why he is little affected by the stock market “chit chat” and by all the rumors. He knows he did his homework before buying a stock, so he doesn’t need to worry. What even makes his faith in his decisions stronger is that because… (read the point below)

  • He is confident: A stock investor has a confident personality. He doesn’t have a lot of insecurities, he knows what he wants (usually money), and he’s after it at all times. He isn’t shaken by somebody else’s opinion about him, or about the way he trades, that’s because… (read the point below)

  • He is consistent: A successful stock investor follows a consistent and disciplined trading approach. He only improves his trading practices, but never alters them. Consistency and discipline are both key attributes to very successful stock investors. On the other hand, since a stock trader wants to constantly improve his trading practices… (read the point below)

  • He is willing to learn: The will to learn is a characteristic that generally differentiates successful from non-successful people. A stock investor who is willing to learn will jump from success to success, but he must ensure at all times that… (read the point below)

  • He is humble: A great stock investor must be humble, he must be open to constructive criticism, he must listen to others, even those who don’t have the trading experience that he has, he must also help others because he knows that there’s plenty of money for everyone and because…. (read the point below)

  • He is not greedy: Greed is not the essence of the evolutionary spirit, greed does not work, greed is not right. In fact, greed will make even the most successful trade a loss. Here’s how: A stock investor buys a stock at $20, the stock goes up to $25 in a couple of days (a 25% increase), the investor, because he is greedy, wants more. The stock goes down $7 in a couple of days, and it’ll take ages before regaining that $20 level. A stock investor is not greedy, he sells when he feels he made enough money on the trade, and the definition of “enough” should be conservative. 2% is good, 5% is great, 10% is very risky! But then again, a stock investor knows that… (read the point below)

  • He is courageous: A stock investor shouldn’t weaken when the market weakens, he shouldn’t panic when two weeks of “red” pass by, he shouldn’t feel terrified (and maybe permanently leave the market) when he logs in to his account and he sees that he lost half of his portfolio, that’s because… (read the point below)

  • He is not emotional: It is very hard for anyone to feel nothing about his money, which he associates with happiness, love, stability, and prosperity… A stock investor shouldn’t be emotional about his money, he should feel absolutely nothing about it, and he’s only able to do this because he trades with risk money, money that he doesn’t need, that’s why there are thousands who enter the market every day, and thousands who leave the market every day: they trade with money that they need. They think that playing the stock market will work when they need the money (while ironically, it only works when they don’t need the money), in fact, every successful investor is successful because… (read the point below)

  • He is wealthy: If you look at the people who make good money on the stock market, you will notice that all of them don’t need the money in the first place, they’re already wealthy anyway, and that’s probably the key characteristic that they very best stock investors have!