September 27, 2011 | In: Technology

How Can I Buy Facebook Stock?

One of my friends asked me earlier today, “How can I buy Facebook stock”? Apparently my friend was so eager to invest in this social revolution that he forgot that he’s not a millionaire (although I wish he was). Now why am I saying that my friend needed to be a millionaire, you might ask?

Well, the reason I’m saying this is that you need to be a millionaire to buy stocks on Facebook, because currently Facebook is trading in some sort of a secondary market that only millionaires have access to, as well as large hedge funds and other investment firms. Facebook is not trading in the public market yet (NYSE, NASDAQ, or AMEX), and probably will not trade in the next year or so (Mark Zuckerberg’s decision to delay the IPO is a wrong one, in my opinion, as the more time it takes for Facebook to become public, the less the hype about it among investors will be, not to mention, of course, that there will be a huge potential that Facebook will be obsolete in a year from now and/or facing stiff competition by a new “jewel” – the same way MySpace was taken by Facebook by surprise).

There is also another way to own Facebook stock, is to get invited by Goldman Sachs to buy Facebook stock through their firm. Just keep your business phone close to you at all times, you don’t know when you might receive a call from Goldman Sachs begging you to invest some of your money in Facebook.

Note that even in this secondary market where Facebook is currently trading, there can’t be more than 500 investors (or is it entities?) owning the stock, otherwise, the company will be forced to make its earnings public and will lose the status of a private company.

Oh, but make sure you know Facebook’s stock symbol first!
I have written about RIM as a company and as a stock so many times before, and I’ve always bashed it. I always thought it was too expensive, that the company has no future, that it will go bankrupt soon, that it won’t recover, etc… I did say though, at one point, that RIM could be a target for takeover. I think all investors should be thinking about a takeover potential more than ever at the moment, mainly because RIM’s total assets are about $12.875 billion (see here), which is around $1.6 billion more than its current market capitalization of $11.29 billion!

RIM’s goodwill is only valued at half a billion, and we all know that RIM’s goodwill value is much more than that at the moment, especially outside the US. The thing is that US customers have little loyalty to brands, unlike people in Europe and the Middle East. RIM has no debt whatsoever, and is only trading at a P/E of 3.94. It really only takes one good product to turn the company around, failing that, RIM is a very, very cheap company at the moment, and whoever buys it will benefit from its market and its customers’ loyalty to blackberry.

Waiting until the dust settles for RIM means that you will lose an opportunity of making about 50% of your investment in a few days. I have always made money on RIM, and I’m sure right now that it’s really, really cheap, regardless of their bad products and their stupid marketing strategies.

RIMM is currently trading at $21.54. In my article about RIM’s takeover, I said that the takeover could happen at the $20 level, so it still have to go down around 7%, which can only be a couple of trading days away at the current trend.

September 16, 2011 | In: Technology

Will Yahoo Survive?

I have written about Yahoo before, and how the company (and its stock) has no future. Some of my opinions were wrong (but some of them were right, remember that post about Netflix a few days ago before it crashed yesterday?), but do I now think that my opinion about Yahoo was wrong?

In short, no, I still stick to what I said. I think Yahoo, regardless of the shifts of CEOs, is still a hopeless company. See, the problem is with Yahoo’s business model. Yahoo is a search engine, and a bad search engine, and not only that, it is a search engine that is no longer using its technology, but rather Bing’s outdated (and maybe stolen) technology (well, if you really want to call it a technology).

Yahoo’s search results contain a lot of spam, and a lot of manipulated results. Not only that, ask any advertiser using both Yahoo and Google to advertise his products about the performance of each, and he will definitely tell you that Google is a much better performer than Yahoo. I know quite a few companies (because of my other job) that were using both Google and Yahoo for advertising, and now stopped using the latter completely.

Yahoo seems so distant from the new social networks it’s not even funny. Why would anyone on this planet think that Yahoo would still be relevant 10 years from now, unless they’re preparing the new super search engine that will return the results as soon as you’re thinking (forget about speaking) of something. So, while the company is trading at a P/E of 16, and that’s not that high, I think the price to earnings ratio should be something close to RIMM’s (around 5). Yahoo’s main business is the search engine, will anyone use it in a few years remains question (well, not for me anyway).

Yahoo investors, get out, the stock is doomed and it should be priced at a mere $4.4 to reflect the future performance of the company, in other words, YHOO is overpriced by 238% (YHOO is currently trading at $14.89).

To conclude, no, Yahoo won’t survive, it’s only a matter of time before investors realize that nothing can be done to save this company, and they will all jump ship.

New traders are often not clear on how much time it takes an order to get filled. Sometimes an order is filled instantly, sometimes it takes hours. So what is the average fill time of an order?

While there’s no scientific data on this, I think it’s safe to say that most orders are executed instantly, or within seconds. It is important to note that the fill time of an order is directly related to the following:

– The liquidity of the stock (for example, C and BAC are very liquid, while low volume stocks are not that liquid at all): The more liquid the stock, the less time it takes for the order to be executed.

– The demand on the stock: Sometimes, when there is some important news about the stock or something related to the stock, there will be huge demand on both sides, and the system for processing the orders will get choked. I remember that my order took hours when I was trading HOUs (oil bullish ETFs) when there was some very important news about oil.

Why do traders need to care about the average fill time? Well, when I bought HOUs a few months ago and my order took hours to get processed, I remember thinking that I bought them at one price and the order was executed at another, higher price. I remember also the same scenario happening, I wanted to sell HOUs, and my order took hours, and then eventually they got sold at a lower price (I couldn’t even cancel the order). I do think that banks make millions out of this game, imagine the following scenario:

– There is a huge load on the system processing the orders, but your buy order goes through anyway
– The bank doesn’t tell you that your order went through
– If, in a few hours, the stock price goes up, then the bank will make it like that the order was processed at the higher price and take the difference between the two prices
– Now If the stock price goes down in a few hours, then the bank will tell you accurately that your order was processed a few hours ago
– And that’s how banks make money!

September 14, 2011 | In: Technology

Is Amazon Overvalued?

While checking an item on Amazon (NYSE:AMZN) this morning, I thought about its stock, is it overvalued? Since Amazon is a website, it’s easy to determine whether its overvalued or not by comparing its traffic for the last 12 months to its stock price over the last month as well.

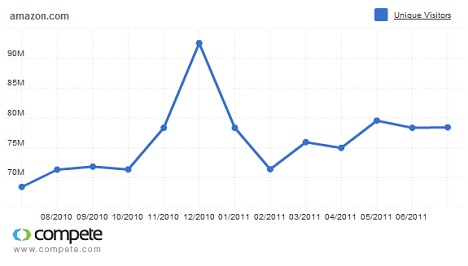
Here’s the traffic (actually I went for 13 months that’s how the traffic chart is generated by default):

Amazon traffic for the past 13 months (well, until end of July 2011)

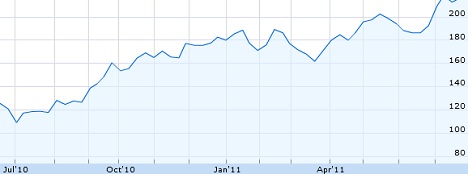
Now here’s the stock price over the past 13 months (from July 2010 until July 2011):

AMZN stock for the past 13 months

Let’s look at the above 2 charts: You can easily see that the traffic to Amazon’s website has increased by 10 million unique visitors year over year, which is around 14%. At best, the traffic to Amazon’s website has increased by 35% in December (which is normal, Christmas season).

As for the stock, it has increased by 82% from July 2010 to July 2011, which is more than double the December spike. The stock went from $122 to $222. Hmmm…. Well, let’s give the stock the benefit of the doubt, maybe it was really undervalued before now it has reached its normal price. But the stock is now trading at a P/E ratio of almost a 100, and this is a website for God’s sake! Let’s say this again, Amazon is a website!

Is Amazon overvalued? Definitely! By how much, well, let’s just say that the stock should be trading at 1/10th of its current price, so it’s overvalued by almost 90%. But hey, how cares? Amazon is nearly identical to Netflix (a company that is worth much less than what it’s currently priced at) when it comes to being overvalued. I wonder which one will collapse first…

I have written before about Netflix, thinking the stock was way overvalued at $132 a share. Of course, whoever reads the article now will laugh, since the stock is now trading at $210!

Do I still stick to what I’ve said before? Absolutely, I think now that NFLX is a dangerous stock, that may pop any day now, regardless what all the analysts are saying. Why do I still think this way? Well, Netflix is very close to market saturation, and its P/E is as high as 53. Not to mention, of course, that competition will soon (maybe very soon) creep in.

Let us examine some numbers: Just over a year ago, when I’ve written the first article about Netlfix, the stock was trading at $132 and its customer base was 15 million subscribers. Today’s customer base is up 10 millions subscribers, to as high as 25 millions subscribers, in the United States, Canada, and Latin America (according to Netflix). This means that there was a 67% increase in the customer base. How does that reflect in the stock? Well, let’s see, 132 x 1.67 = $220, which means that investors, at this current moment, value Netflix less than what they used to value it a year ago, not by much, but enough to say that investors no longer anticipate huge growth potential in Netflix

Imagine if Netflix cannot add as many customers next year as it did this year, what will happen? Investors will definitely believe that Netflix has reached a point where it can no longer maintain the growth, and a point where its only aim is to maintain its current customers, maybe through better deals and reduced pricing, which, in its turn will reduce the profitability of the company, which in its turn reduce the price of the stock.

Now let’s think about Netlflix as a business model, will their business model survive in 10 years, 20 years, 53 years? I doubt it that the business model will survive in 10 years, with all the breakthroughs especially in the entertainment industry, and I’m confident that Netflix will cease to exist (at least in its current form) 20 years from now. So why is the market valuing it at a P/E ration of 53? No idea. Regardless of how many subscribers Netflix can add next year (or quarter), the company will not impress investors. Competition will be very fierce in that area, especially from Google (a company that wants to diversify its products) and Apple.

But how much is Netflix really worth as a company?

I don’t know for sure, but I would trade such a stock at a P/E of only 10 (the future is not as bright as the present for Netflix), which means that each stock should trade, in my opinion, at around $40. And since Netlfix has 52.54 million shares, this means that Netflix, as a company, is worth $2.10 billion, and nothing more. The $9 billion extra on its market cap are just pure hype, and you will see them quickly vanish the moment Netflix misses an estimate.

Will I short Netflix? Never, but I will never trade it either.

September 9, 2011 | In: Trivia

How Much Does a Gold Bar Weigh?

With all the current fever about gold, I was thinking, what if I bought a gold bar (those gold bars used in reserve banks that we see either on the news or in movies where thieves try to steal the chest at a federal bank) when gold used to trade at $200/troy ounce (troy ounce is different than an ounce, as it weighs slightly less, about 31.10 grams. When you see that gold is trading at, for example, $1,800/ounce, they mean troy ounce, not the ounce you use in the kitchen measurements) a decade ago. I thought the gold bar weighs one kilogram (or 2.2 pounds), and I did have more than $6,600 at that time (1 kg has about 32.15 troy ounces). However, I used to always think that the gold bar seems to be a bit large, and that the density of gold is 19.3, almost 20 times that of water. Which means what might look like 1 kg for water in gold, really weighs about 20 kilograms.

So, how much does a gold bar weigh? Well, according to all the resources I could find, the gold bar weighs 400 troy ounce, or 12.44 kg or 27.42 pounds. Now that we know how much it weighs, how much does a gold bar cost in this day and age. Well, at this very second, it costs (if you want to buy one) only $754,800 (Obviously I wasn’t able to afford it even a decade ago, as it used to cost $80,000, and not $7,000 as I thought!).

If you really want to know, the dimensions of the standard gold bar that is used as a reserve in the banks are: 17.78 cm x 9.21 cm x 4.45 cm or 7 inches x 3.625 inches x 1.75 inches.

In case you’re wondering, yes these movies where you see thieves having a big bag full of gold bars carrying it easily over their back are totally fake. These bags always seem to contain around 50 gold bars, which weigh slightly over 600 kg. I don’t think there exists, at least on this planet, someone who can carry 600 kg of gold over his back while running!

September 8, 2011 | In: General

What Is the Average Fill Price?

In my previous article clarifying how stocks prices are set, I have mentioned the term average fill price. So, what is the average fill price and how is it calculated?

When I first started trading, I used to only trade very liquid stocks such as BAC and C, and at very small quantities, so, when I used to submit an order, the order used to take a few seconds to get filled, and I used to always see something like the following (in the details of the order):

500 shares of BAC: Fill Price $15
Average Fill Price: $15

I thought that the average fill price used to be always equal to the price of the stock in the market, which, as I later discovered, is wrong.

At first, I didn’t care about the term a lot, but I started paying more attention when I began trading small cap stocks such as BIOS. I remember that BIOS was trading at around $4.30 a bit more than a year ago, when I submitted an order of 1,000 shares. Here’s what I saw (that order, as I recall, took a few minutes to get filled):

400 shares of BIOS: fill price $4.30
300 shares of BIOS: fill price $4.35
200 shares of BIOS: fill price $4.37
100 shares of BIOS: fill price $4.40
Average fill price: $4.34

I then understood, because the stock was not that liquid, and my order was relatively large, the order was looking for stocks to sell at a higher price, until it was completely filled. So, it started with 400 shares at $4.30 (which was the price that I wanted to buy at), and then it couldn’t find any shares at that price, and the shares to be sold with the closet price were 300 shares at $4.35. My order consisted of several transactions, and the average price/share at which my order was filled is called the average fill price. So, in my case, the average fill price was:

Average fill price = (400 x $4.30 + 300 x $4.35 + 200 x $4.37 + 100 x $4.40)/1000 = $4.34

Here’s the formula:

Average fill price = Σ(number of shares per transaction x fill price per transaction) / total number of shares per order

The average fill price is the price at which you bought (or sold) the stock. So, in case of a buy order, if the stock price goes above your average fill price, you will make money, otherwise, you will lose money (Note that I’m not taking commissions into consideration).

Note that it is not always the case to see the average fill price higher than the price of the original transaction in the order. In many cases, when the stock is experiencing a huge drop, the fill price of each subsequent transaction in the order will be lower than the price of the first transaction, and thus the average fill price will also be lower than the price of the original transaction.

Another note is that even if your order consists of several transactions, you will only be charged one transaction fee (for example, if your broker charges $10 a trade, and your order consisted of 5 transactions, you will only be charged for $10).

This article (as well as all other articles on this website) is an intellectual property and copyright of Fadi El-Eter and can only appear on fadi.el-eter.com.

September 8, 2011 | In: General

Who Sets the Price of Stocks?

Many beginners in the stock market, as well as would be part-time stock traders, want to know who sets the price of stocks. They think that there’s an entity/organization who is responsible of setting the price of a stock. Now while stocks in the US are regulated by the SEC (Securities and Exchange Commission), the price of each individual stock is set by the investors. In short, the price of a stock is set by the price that one is willing to sell at, and another is willing to buy at. In shorter, the price of a stock is set by supply and demand. Here’s how:

Let’s say someone (Investor Y) wants to buy 10,000 shares of NFLX at the current price is $216. This means that there are some investors, owning Netlfix shares, who are willing to sell at that price. Here’s a breakdown of those investors (I’m only giving an example):

– Investor A: Owns 500 shares willing to sell at $216
– Investor B: Owns 1,000 shares willing to sell at $216
– Investor C: Owns 5,00 shares, also willing to sell at $216

When Investor Y executes the trade, his order will be immediately filled with 2,000 shares at $216. Now he still needs 8,000 shares for the order to be completely filled. There are some traders who are willing to sell, but a slightly higher price:

– Investor D: Owns 4,000 shares willing to sell at $217
– Investor E: Owns 4,000 shares willing to sell at $218

So, the order will then be automatically filled with shares that have the closest price to the previous trade, which are the above shares. The order now is filled with 10,000 shares: 2,000 at the price of $216, 4,000 shares at the price of $217, and 4,000 shares at the price of $218. The average fill price for the investor would be: $217.2 (I will discuss the average fill price in a later article).

At the end of the transaction, the price of the stock will be $218, up $2.

Now let’s look at this from the opposite perspective. Let’s say that Investor Y wants to sell 10,000 shares of NFLX, at the current price of $216. When the order is executed, the system will find the following:

– Investor I: willing to buy 4,000 shares at $216
– Investor J: willing to buy 2,000 shares at $215
– Investor K: willing to buy 4,000 shares at $212 (notice the drop of $3 from the above price)

The order will be filled with 4,000 shares at $216, 2,000 shares at $215, and another 4,000 shares at $212. The total sale will be for $2,142,000 and the average fill price will be $214.20. After the order is completely filled, NFLX will drop $4 to $212.

Now what will happen if nobody wants to sell or buy? Usually this situation doesn’t happen with stocks that have high liquidity, but it does happen with stocks that are not very liquid, especially when the number of shares requested (to sell or to buy) in one single order is relatively very large (when taking the average daily volume into consideration). In this situation, the stock price will keep going up (if it’s a buy transaction) or down (if it’s a sell transaction) until it finds someone who’s willing to sell or to buy. This is why so called small cap stocks are very volatile when compared to large cap (or blue chip) stocks.

Note that the buying/selling/filling process is completely automated in this day and age, and hence, you can say that the price of a stock is determined by a computer!

This article (as well as all other articles on this website) is an intellectual property and copyright of Fadi El-Eter and can only appear on fadi.el-eter.com.

I have previously explained wash trading, which is an illegal and prohibited practice for a long time now. However, there is a similar stock trading activity that is legal in some situations and practiced all the time, it is called a wash sale. A wash sale is the process by which someone sells his losing shares for tax deduction purpose, only to buy them back in the new year.

For example, let’s assume that someone bought a 1,000 shares of BAC at the beginning of the year when they were trading around $15. Assuming BAC closes the year 2011 at around $8, that individual will be left with a loss of $7,000. What that person does is that he sells these stocks at the end of the year, claiming an unrealized loss on his taxes, and then buys the 1,000 shares again in January, thinking that BAC will recover. As you probably would have guessed, a wash sale is the main reason behind the January effect. It is important to note that in the US, an investor cannot claim an unrealized loss from this transaction if he buys back the same securities in less than a month after he sells them. However, he’s able to add the loss, per share, to the price of each share he buys back. Let me explain, say the investor above buys back the stock at $9 in January of next year, if, at one point in 2012, the investor sells his BAC shares at $20 each, then he will only have to report gains (for tax purposes) based on the stock price of $16 ($9 price of the stock when he purchased it the second time plus $7 his loss from his first purchase). I know what most people will think right now, that a wash sale is essentially useless. Maybe, I wouldn’t care about doing it myself as I personally don’t see the point…

You can clearly see that a wash sale is completely different from a wash trade, where in the latter case, an investor buys and sells the same security in order to artificially inflate the volume and attract other investors.