August 14, 2010 | In: Uncategorized
NVDA: An Interesting Stock With A Predictable Pattern
I have been following NVDA for over 2 weeks now, when they lowered their sales outlook. NVDA, a major graphics card manufacturer for consoles and PCs, is directly affected by what’s going on in the Video Games Industry (which is not looking good) as well as the PC sales.
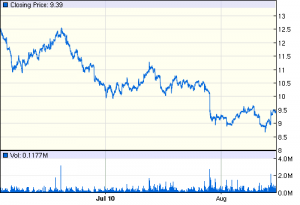
Here’s the NVDA graph for the last 50 days (courtesy of Google Finance):

I think this is a very interesting graph, the stock has a clear downward trend (I don’t know for how long this will remain, maybe until NVDA comes with something new, or the demand for PS3s increase again) with peaks nearly every week. From what you can see, it is unwise to buy NVDA at this price ($9.43 in after hours trading), as it is a peak if we want to technically follow this trend. If the trend is supported in the next week, the stock will most likely drop to below $9, which is an excellent entry point. The stock should be exited at $9.30, and rebought again at $8.90 (repeat forever, until the trend is broken, and the bullish sentiment regains). Just don’t get bullish on this stock just by looking at technical indicators, see what’s happening in the PC and the consoles industry.